Bitcoin (BTC) Price Analysis — Reversal Candlestick At Make-Or-Break Level

Bitcoin (BTC) Price Analysis - Reversal Candlestick At Make-Or-Break Level

Bitcoin (BTC) Price Analysis — Reversal Candlestick At Make-Or-Break Level


Bitcoin is down to the last line of defense for bulls but a reversal candlestick is forming.

BITCOIN PRICE ANALYSIS

Bitcoin is consolidating inside a symmetrical triangle on its daily time frame and is currently testing support. This could be the last line of defense for buyers, as a break below support could signal that a longer-term selloff is underway.


However, a reversal candlestick or a doji appears to have formed right on support, and it would need the next candle to close above the high to confirm the possible bounce. If so, bitcoin could still climb up to the top of the triangle around $8,750-9,000.


The 100 SMA is below the longer-term 200 SMA, though, so the path of least resistance is to the downside. In other words, the selloff is more likely to persist than to reverse. The gap between the moving averages is also widening to reflect stronger selling pressure.


Meanwhile, RSI is already hovering around oversold levels to reflect exhaustion among sellers. Similarly, stochastic has reached the oversold region to signal that the drop may be over. Turning higher could draw buyers back in and allow bitcoin to pull up from its drop.


There are still no positive developments being reported from the industry so far, which might keep bitcoin exposed to risk flows throughout the week. In the previous week, geopolitical risk has led to some demand for the safe-haven dollar even as the FOMC minutes signaled a slower pace of rate hikes later on.

Up ahead, the NFP report could be the main catalyst for the dollar, although market watchers will likely keep close tabs on US-China and US-North Korea talks. Further tensions could keep the lower-yielding dollar supported versus bitcoin.

Another factor that’s limiting bitcoin gains is the selling of Mt. Gox coins to pay off its creditors. This exchange held thousands of bitcoin, so it’s understandable that the liquidation of massive amounts has affected the market.


By Rachel Lee On May 28, 2018


Posted by David Ogden Entrepreneur

Alan Zibluk Markethive Founding Member

87.5% of all Bitcoins [BTC] will be mined by 2020 – Here’s why it matters!

87.5% of all Bitcoins [BTC] will be mined by 2020 – Here's why it matters!

87.5% of all Bitcoins [BTC] will be mined by 2020 — Here’s why it matters!

The block reward for Bitcoin will halve next in about two years from the time of publishing this article. The estimated time for the next half of the reward is around 732 days, but it is relevant now for a few reasons.

The current bear market offers opportunities for investors to buy and hold Bitcoin, as it is currently trading at a low since the past week. It has been plagued by sell-offs and FUD, along with a general bearish trend. Market sentiment is also low after the CFTC and US Justice Department declared the existence of a probe into cryptomarkets for fraudulent practices.

As the price is currently low, interest by institutional investors is on a high after a successful Consensus conference and general adaptive behavior. News such as Goldman Sachs beginning a cryptocurrency trading desk and JPMorgan’s high-level reshuffling to focus on cryptocurrency may as well be the tip of the adoption iceberg.

As the 17 millionth coin was mined sometime last month, a reality check descended on the market that the amount of Bitcoin left in existence is limited. Even as digital assets tend towards digital abundance, Satoshi’s blockchain allows for real digital scarcity with real-world parallels. The 21 millionth coin will be mined in around 2140, approximately. The time, electricity, and computing power required to mine new coins is constantly increasing, with Murphy’s law being barely able to keep up.

As the block reward is halved every 210,000 blocks, it constantly decreases the rate at which it is possible to create new Bitcoin tokens. The new landmark on ETA, 28th May 2020, will decrease the reward from the current 12.5 coins to 6.25 coins. The total coins mined before the next halving of the block reward will be 18,375,000, which marks 87.5% of the possible 21 million Bitcoin tokens.

This will then exponentially reduce the speed at which new Bitcoin come into existence, spiking up demand for the coin due to reduced supply. Analysts predict that this bear market will be the last one before 2020.

Crypto analyst Trevor Wade says:

“This bear market is the last chance for investors to buy into Bitcoin before the price goes up to $10000+. Reduced block rewards will result in supply cutting off and demand going up, which will cause an exponential spike. Regulators and institutional investors are moving in in a safe way, allowing for large-scale adoption of financial system disruptors.”


Author Anirudh VK May 27, 2018


Polsted by David Ogden Entrepreneur

Alan Zibluk Markethive Founding Member

World’s Largest Diamond Jewelry Retailer Joins De Beers Blockchain Pilot

World's Largest Diamond Jewelry Retailer Joins De Beers Blockchain Pilot

World’s Largest Diamond Jewelry Retailer Joins De Beers Blockchain Pilot

De Beers Group has announced that the world’s largest diamond jewelry retailer has joined their diamond supply blockchain platform Tracr, according to a press release published May 24. Signet Jewelers joined the project, which aims to bring transparency to the industry, in addition to boosting consumer confidence.

Signet will join the Tracr platform in its pilot version, which according to the press release, will enable the platform to complete a “digital link” from diamond production to its retail location. The parties will ensure that the platform corresponds to the needs of manufacturers and retailer, initially focusing on the tracking of diamond jewelry.

Tracr creates a digital certificate for each diamond, which will be registered on the platform and contain key attributes and transactions. This will reportedly let consumers verify that diamonds they purchase are natural and conflict-free. Bruce Cleaver, CEO at De Beers Group, commented on the partnership:
 

“…Tracr is focused on bringing the benefits of blockchain technology to the full diamond value chain — providing consumers with confidence, the trade with increased efficiency and lower costs, and lenders to the industry with greater visibility.”


Signet Jewelers is headquartered in Ohio and operates in Canadian, American, and British markets, where it holds the number one position among diamond retailers. In 2017 it made over $3.8 bln in diamond jewelry sales. According to their 2018 annual report, Signet Jewelers has a market share of 7 percent of the US jewelry market.

Earlier this month, Cointelegraph reported that De Beers tracked 100 high-value diamonds from the mine to the retailer by means of blockchain technology. This was reportedly the “first time a diamond’s journey has been digitally tracked from mine to retail.” De Beers said that the Tracr platform is expected to launch later this year and will be open to the entire diamond industry.

Yesterday, two leading diamond industry players, KGK Diamonds and Alrosa, agreed to work with blockchain startup D1 Mint Limited to tokenize diamonds. It is believed that the innovation of blockchain can transform the precious gem industry by making natural diamonds into an investment asset class with wider appeal across “various investor groups, driv[ing] higher demand.”


Author Ana Alexandre

Posted by David Ogden Entrepreneur

Alan Zibluk Markethive Founding Member

Bitcoin (BTC) Price Watch — Can It Finally Bounce?

Bitcoin (BTC) Price Watch - Can It Finally Bounce

Bitcoin (BTC) Price Watch — Can It Finally Bounce?


Bitcoin Price Key Highlights


  • Bitcoin price is still inside its symmetrical triangle formation and is currently testing support.
  • A bounce could take it back up to the resistance around $9,000 while a break lower could lead to a test of the next support at $6,500.
  • Technical indicators are showing mixed signals, so the move could mostly depend on market catalysts.

Bitcoin price has sold off to the very bottom of its symmetrical triangle formation, still pending a bounce or a break.

Technical Indicators Signals


The 100 SMA is below the longer-term 200 SMA so the path of least resistance is still to the downside. This suggests that a breakdown is more likely to happen than a bounce.

The gap between the moving averages is also widening to show accelerating bearish momentum. Also, price is below the 100 SMA dynamic inflection point to reflect continued selling pressure.

RSI is heading south to show that sellers have the upper hand, but the oscillator is already dipping into oversold territory to signal exhaustion. Turning higher could draw buyers back in and lead to a bounce back to the resistance. Similarly, stochastic is indicating oversold conditions but has yet to turn higher to signal a return in bullish pressure.


Market Factors

Regulatory fears are being blamed for the recent leg lower in bitcoin price, although this could prove positive for the industry in the longer run. The US Department of Justice is reportedly conducting a criminal probe into price manipulation practices involving cryptocurrencies.

It’s worth noting that the dollar has been on weaker footing following the FOMC minutes release and the recent announcements related to North Korea. Trump has cancelled his meeting with Kim Jong-Un for next month, reviving geopolitical tensions but weighing on the US currency. However, bitcoin price has been unable to take advantage of this as it also seems to have been dragged lower by risk sentiment.


Author SARAH JENN | MAY 25, 2018 | 4:28 AM


Posted by David Ogden Entrepreneur

Alan Zibluk Markethive Founding Member

Bitcoin and Ethereum Price Forecast – BTC Prices Crash Through Support

Bitcoin and Ethereum Price Forecast – BTC Prices Crash Through Support

Bitcoin and Ethereum Price Forecast — BTC Prices Crash Through Support

The BTC prices have fallen hard over the last few hours and the prices now trade below the $7500 region as of this writing. We had mentioned yesterday that the support region around $7800 was under severe pressure and if and when there is a break through this region, we should see the bears back in control and that’s what we are seeing now. There are no specific reasons for the fall in prices, as the BTC prices lack fundamentals but we could say that the general risk off sentiment that is seen in the markets could also be one of the reasons.

Prices Below $7800

The lack of fundamentals is also telling and the lack of momentum from the bulls could also be attributed to this fall. The prices have been trading near the support region for far too long and the investors and the traders, who are weak holders, have got tired of this loss of momentum and they were looking for the first opportunity to exit the market and once they saw that the prices began to fall slightly, they have taken the opportunity to sell off and push the prices even lower. Now, we are probably looking even further below for support which could once again come in the $6600 region but if and when the prices get there, we could be seeing some serious panic in the markets.


The ETH prices have also crashed lower and the prices are now trading below the $600 region as of this writing. Just as how the move higher in the prices was strong, we are seeing the move lower also being quite strong and this has led the markets to be under a lot of pressure of late. We believe that the market is likely to find some support in the $580 region but we have to see whether that would be enough to hold off the selling that we are seeing.


Forecast

Looking ahead to the rest of the day, we could see the selling continue for the short term though some decent supports are nearby in both the BTC and ETH markets. We would wait to see a turnaround in the risk sentiment and if and when that happens, we could see the prices move up higher.


Author Colin First


Alan Zibluk Markethive Founding Member

Bitcoin (BTC) Price Watch — Kashkari Comments Bring Sellers In

Bitcoin (BTC) Price Watch - Kashkari Comments Bring Sellers In

Bitcoin (BTC) Price Watch — Kashkari Comments Bring Sellers In

Bitcoin Price Key Highlights

  1. Bitcoin price resumed its drop as price is now breaking past the mid-range area of interest.
  2. This could put it on track towards testing the range floor at the $6,550 level.
  3. Technical indicators are confirming that selling pressure is still in play.

Bitcoin price seems poised for more losses as it reeled from Kashkari’s remarks and is setting its sights on the range bottom.


Technical Indicators Signals

The 100 SMA is below the longer-term 200 SMA to signal that the path of least resistance is to the downside. This means that the selloff is more likely to continue than to reverse.

The 100 SMA also seems to have held as dynamic resistance and would likely keep further gains in check in another pullback. The gap between the two moving averages is also widening to reflect strengthening bearish pressure.

RSI is pointing down to confirm that sellers are in control and could further weigh on bitcoin price. Similarly stochastic is on the move down to show that bearish momentum is present. In that case, bitcoin price could make it all the way down to the bottom of the range.

However, both oscillators are also nearing oversold conditions to reflect bearish exhaustion. If buyers return as the oscillators pull up, the middle of the range could attract some buyers and lead to a bounce back to the top.


Market Factors


FOMC member Neel Kashkari had some negative remarks on the cryptocurrency industry this week, and the lack of positive catalysts left these altcoins vulnerable to selling pressure. He noted:

It’s a clever idea that some people came up with, but now it’s being taken to ridiculous extremes. The barrier to entry to creating a new cryptocurrency is zero.

Furthermore Kashkari mentioned:

If you can dupe enough people to buy it, you can pretend that you’ve launched something. And you can say, ‘Look, I’m a billionaire because I sold you one. And I own the other 999 million of them, so that means I’m a billionaire! So it has become a farce…I’m seeing more noise and more fraud than I’m seeing anything useful.


Author: SARAH JENN | MAY 23, 2018 | 4:18 AM


Posted by David Ogden Entrepreneur

Alan Zibluk Markethive Founding Member

Brian Kelly — Bitcoin Cash Could Go Up Following More Use Cases

Brian Kelly - Bitcoin Cash Could Go Up Following More Use Cases

Brian Kelly — Bitcoin Cash Could Go Up Following More Use Cases


Brian Kelly, the founder and CEO of BKCM LLC, an investment company focused on cryptocurrencies, came out bullish on Bitcoin Cash (BCH) on CNBC May 21.

On Saturday, BCH miners reportedly had a meeting dedicated to funding for a BCH development fund. Miners are looking to allocate some part of the reward they receive from mining and invest it to expand the BCH ecosystem, Kelly explained. The fund development could aid the rise of the cryptocurrency’s value. He continued:

"That's how blockchains gain value. You're going to be getting more use cases to the extent that usefulness translates into value. That could be a positive for bitcoin cash."

After the price surge to $1600 on May 5, BCH subsequently declined to the 50-day SMA and formed a head and shoulders pattern, which has a target objective of $650. Over the last 24 hours, BCH has lost almost 5.8 percent in price, from $1290 to $1205. Still it is valued significantly higher than its April level of $760.

BCH is a peer-to-peer digital currency established in mid-2017 as a result of the hard fork of Bitcoin that took place to solve the scalability problem. With upgraded consensus rules, BCH is able to grow and increase the size of blocks, allowing more transactions to be processed.

Earlier this month the pro-Bitcoin community dropped its plans to level a lawsuit at the site Bitcoin.com. Members were outraged that the crypto and wallet service, which is run by BCH evangelist Roger Ver appeared to be misleading buyers by muddling the distinction between BTC and BCH.


Author Ana Alexandre

Posted by David Ogden Entrepreneur

Alan Zibluk Markethive Founding Member

Bitcoin Price Analysis — Consolidation continues

Bitcoin Price Analysis - Consolidation continues

Bitcoin Price Analysis — Consolidation continues


Bitcoin (BTC) has continued to seesaw, sliding 20% since May 6th and then recovering slightly over the past few days. The market cap now stands at US$144.86 billion, with US$1.64 billion traded in the past 24 hours.

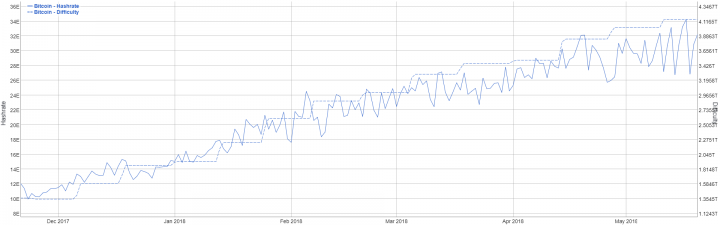
On the network side, hash rate and difficulty continue to push record highs, with ongoing shipments of ASICs from multiple mining companies, including Bitmain and Halong. Although the original Bitcoin Whitepaperdescribed Proof of Work (PoW) as “one-CPU-one-vote,” the lead SIA coin developer David Vorick argues that “for any algorithm, there will always be a path that custom hardware engineers can take to beat out general purpose hardware.”


Furthermore, ASIC chips are typically manufactured by a small number of technology companies, meaning the bulk of the network is running on the same hardware. If that hardware is found to be faulty or exploitable, the entire network is at risk.

Concerns over PoW have not been limited to ASIC proliferation. A recent presentation by Alex de Vries of Price Waterhouse Cooper in the Netherlands, “Bitcoin's Growing Energy Problem,” concludes that Bitcoin currently consumes at least 2.55 GW of electricity, and is on pace to consume 7.67 GW in the near future. This leaves the networks energy consumption comparable to countries such as Ireland now (3.1 GW) and Austria in the future (8.2 GW).

Others see this as an energy revolution opportunity. Peter Van Valkenburg of CoinCenter, a non-profit research and advocacy center focused on the public policy issues facing cryptocurrency in Washington D.C., has argued that instead of destroying the planet, Bitcoin will push the energy market towards more sustainable alternatives, driving an energy revolution. Mining in Canada and Iceland uses hydro and geothermal power, while wind and solar are among the cheapest energy sources available. Bitcoin advocate Andreas Antonopoulos shares this view and has questioned the hidden resource needs required by other payment platforms.

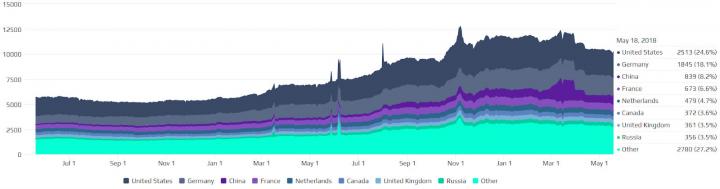
However, the number of network nodes has fallen slightly over the past few months after reaching more than 12,500 in November. These statistics include mining and non-mining nodes. Although archival nodes are not incentivized directly with a block reward, they ensure network consensus. Based on global distribution, the United States and Germany have the highest percentage of nodes.


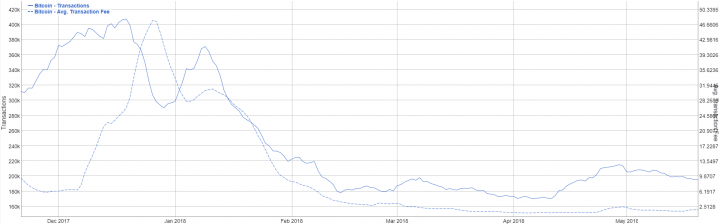
Transactions per day remain down sharply from the record high in December, above 400k, and are currently below 200k per day. Transactions have not only declined due to a lack of usage but also transaction batching, where one transaction is sent to many addresses at once instead of each transaction being sent individually.

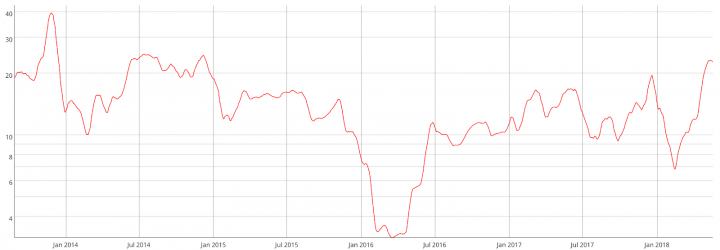
Using an adjusted network value to transactions (NVT) ratio, BTC remains in the upper-third of historical NVT value. While NVT has not been this high since January 2015 it has begun to turn downward recently, which suggests increasing on-chain network utility based on the dollar amount being transacted.

Although NVT is difficult to compare between coins, which use different transactions types, the ratio can be used to assess the network’s relative utility over time. DOGE is the only coin that has had an NVT consistently lower than BTC (not shown). Additionally, inflexion points in NVT ratio can be correlated to extreme highs or lows in price.

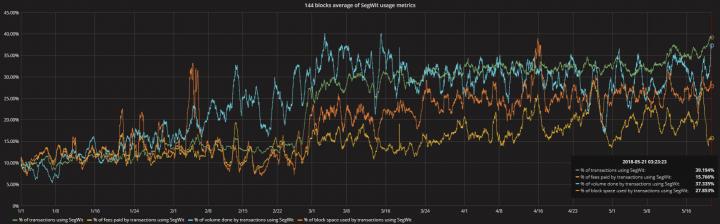
Transaction fees, which increased dramatically throughout 2017, have also declined significantly. This fee reduction is also multifactorial. Although a decrease in transactions per day means fewer transactions needing to be cleared, SegWit, which currently accounts for 39% of transactions, has also been a significant contributing factor to the average fee decline.

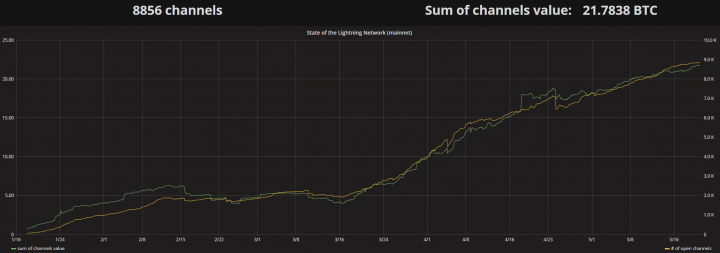
The SegWit soft fork also enabled second layer network upgrades like the Lightning Network. Since going live on March 15, the Lightning Network (LN) has continued to gain traction as new channels come online and apps are created.

The software solution enables trusted, bidirectional, off-chain, hub and spoke payment channels and also promises the possibility of instant payments, microtransactions, and increased scalability. The channels work much like a tab at a restaurant, which remains open until the client settles the bill. This format allows for numerous transactions to occur without a network fee until the channel is closed.

At Consensus NYC, Square co-founder and CEO Jack Dorsey and Lightning Labs co-founder and CEO Elizabeth Stark discussed their vision for the future of payments. Dorsey, who had an early interest in hacker and cypherpunk movements, was also an investor in a Lightning Labs seed round.

Dorsey focused on the need to keep Bitcoin an open source project and the need for a native currency of the internet. He also hinted at a Square and Lightning partnership down the road saying, "We want to go back to that original idea of being able to purchase a coffee with it. And that's why we're working with Lightning Labs. Whatever it takes to get there, we're going to make sure it happens."

During his keynote speech at Consensus, eToro CEO Yoni Assia announced a new American crypto platform which will be trading Bitcoin, Ethereum, Litecoin, XRP, Dash, Bitcoin Cash, Stellar, Ethereum Classic, NEO, and EOS. Cryptocurrency trading on eToro increased by 4,500% in 2017, according to MarketWatch.

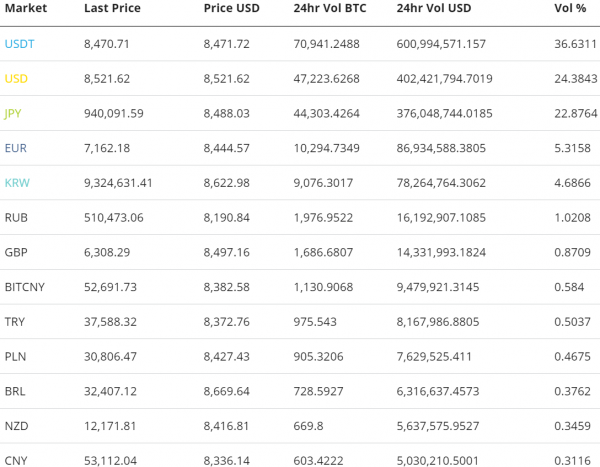
Bitcoin exchange traded volume this week has been led by the Tether (USDT) and USD markets for the fourth consecutive week, mostly on Binance, OKEX, and Bitfinex. In Asia, the JPY volume strongly leads the pack, thanks to friendly regulations and oversight, including declaring Bitcoin legal tender. The KRW premium is currently at 1.78%. CNY volume continues to fade.

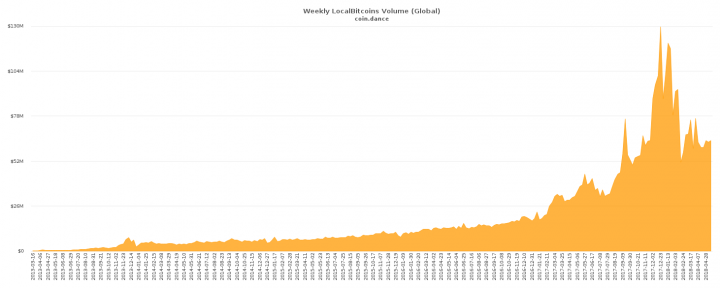
Globally reported over the counter (OTC) volume from LocalBitcoins.com remains sharply down from December and January but has begun to increase again. Venezuela continues to post record highs in Bolivar volume, fueled by hyperinflation. Thus far, the hyperinflation rate has followed an almost identical trajectory as the Weimar Republic. The Venezuelan president, Nicolás Maduro Moros, won the national election earlier today.


Technical Analysis

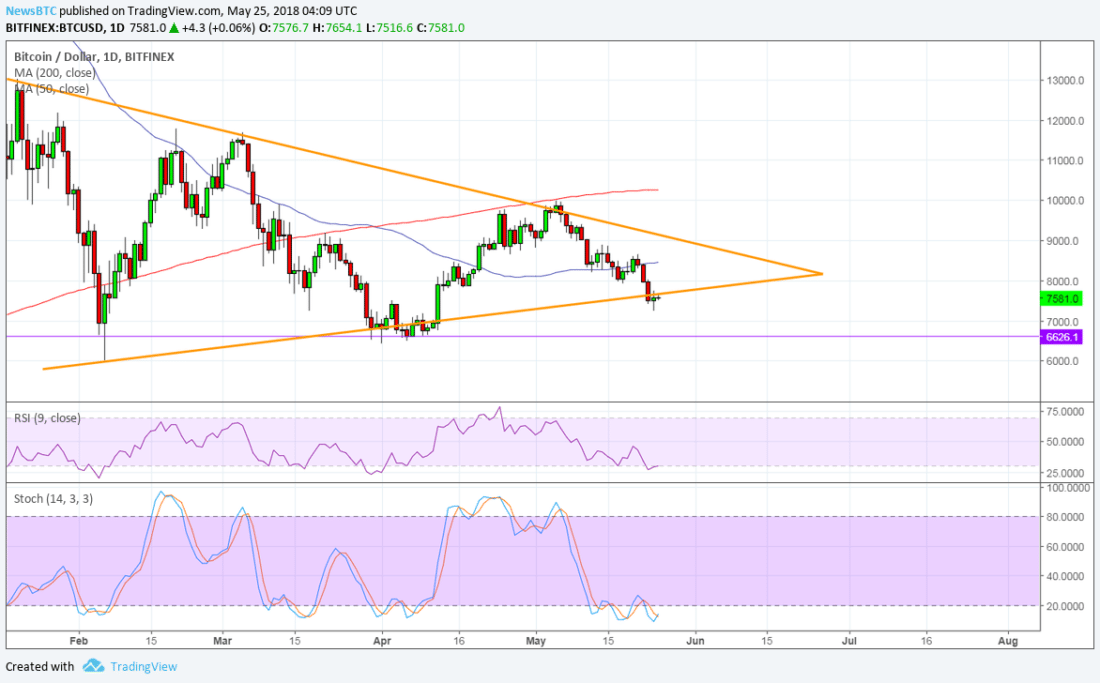
Bitcoin continues to drift sideways on low volume, with an inability to establish a clean trend on high timeframes. The status of any emerging or nascent trend can be determined using Moving Averages, Chart Patterns, Ichimoku Cloud, and Pitchforks. Further background information on the technical analysis discussed below can be found here.

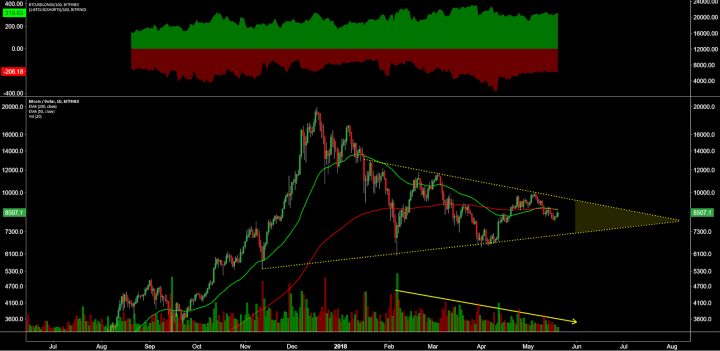
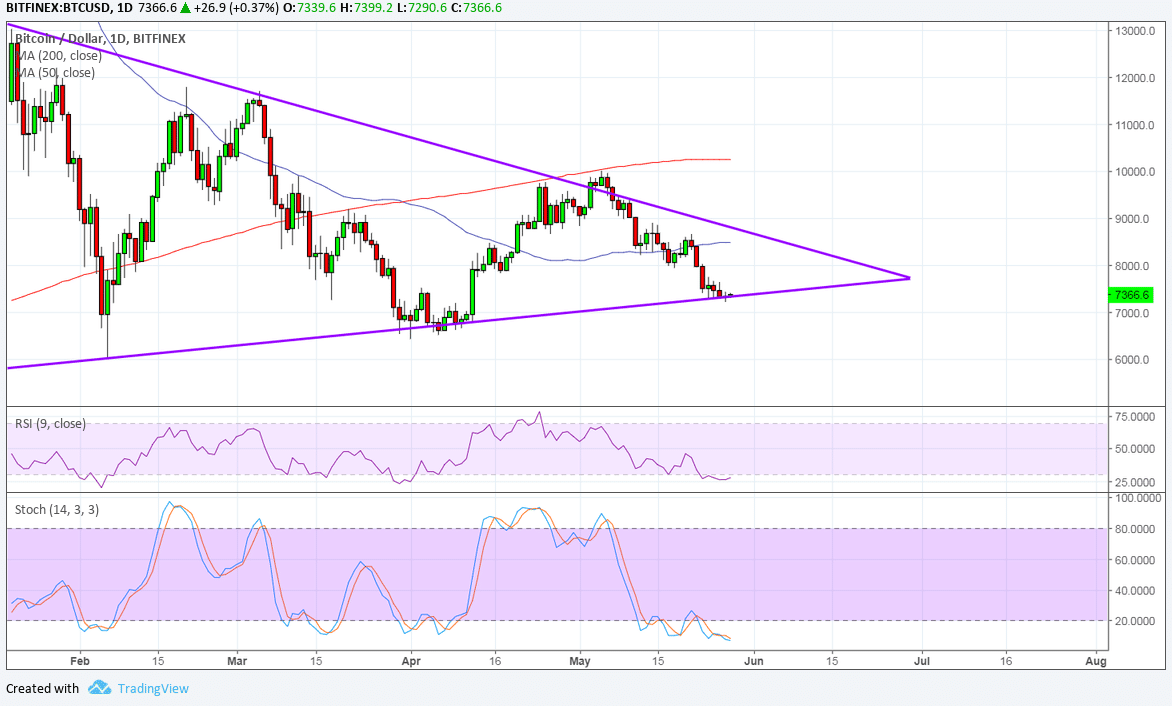
On the daily chart, open long/short interest on Bitfinex leans long, with shorts flat and longs rising (top panel, chart below). Exponential Moving Averages (EMAs) have gone flat, suggesting price consolidation. Price has fallen below the 200EMA with a bearish 50/200EMA cross.

Price structure shows a multi-month symmetrical triangle, or coil. In Technical Analysis of Stock Trends (1948), Edwards and Magee suggest that roughly 75% of these triangles lead to a continuation of the trend, while the rest mark reversals. In any case, this pattern will be a ‘trade the breakout’ situation because it will likely lead to weeks of trend follow through. Breakouts post consolidation typically occur after at least 66% of the triangle has completed (yellow highlight).

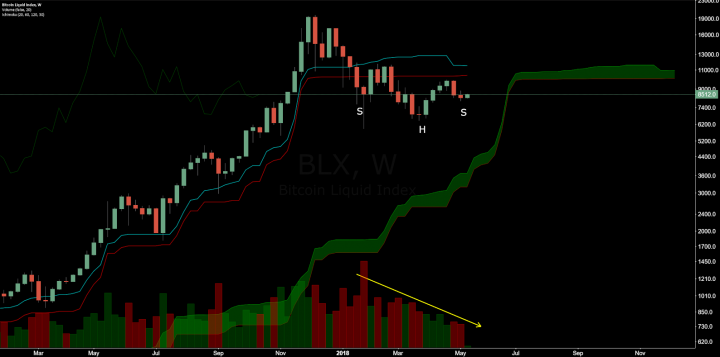
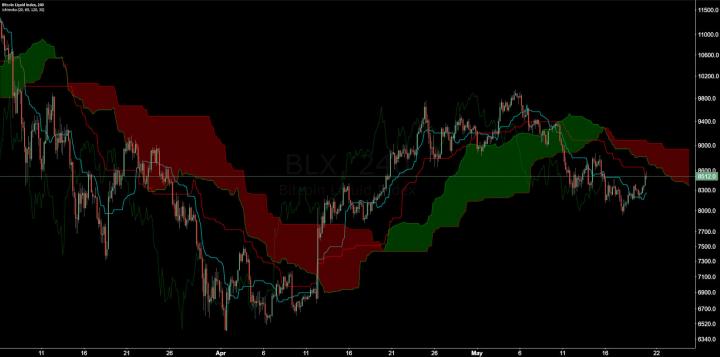
Turning to the Ichimoku Cloud on the weekly chart, there are four metrics; the current price in relation to the Cloud, the color of the Cloud (red for bearish, green for bullish), the Tenkan (T) and Kijun (K) cross, and the Lagging Span. The best entry always occurs when most of the signals flip from bearish to bullish, or vice versa.

The Cloud metrics on the weekly time frame are; price above Cloud, bullish Cloud, bullish TK cross, and Lagging Span above price and Cloud. Together, these signals suggest the trend is bullish, and will remain bullish until a bearish TK cross or price dips below the Cloud.

Price itself is below the Kijun and, seemingly, in no-man’s land. Price and volume structures suggest the possibility of an unconventional inverted head and shoulders, a bullish reversal pattern. A long entry would not be warranted until price is above the Kijun, essentially also above the neckline of the head and shoulders chart pattern.

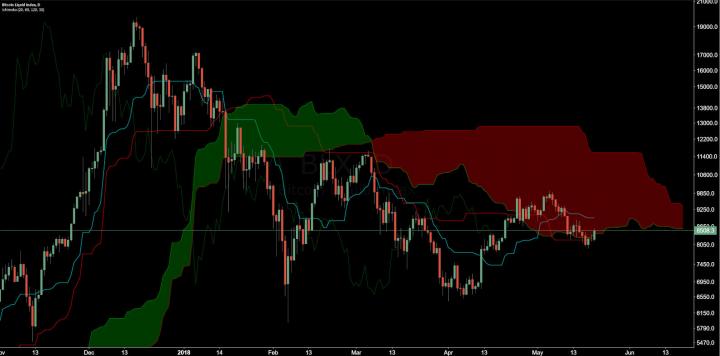
The Cloud metrics on the daily time frame are; price inside Cloud, bearish Cloud, bullish TK cross, and Lagging Span above price but below Cloud. A long entry based on traditional Cloud rules does not occur until the Cloud is breached by price, currently at ~US$11,586. However, a long reversal trade opportunity known as the Edge to Edge (E2E) trade can be taken advantage of with the current Cloud structure.

A long entry based on the E2E trade occurred several days ago, with a stop loss below the Kijun. Price dropped out of Cloud and below the Kijun, suggesting any active longs should be closed at that time. Although price has breached Cloud resistance for the second time, traders may avoid entering a second E2E trade this quickly as the previous E2E trade failed.

An E2E failing to reach its target is often an indication of additional consolidation being needed before price momentum returns. Price typically follows through with the direction of the E2E trade, but not until the Kumo twist, which in this case will occur after June 19th.

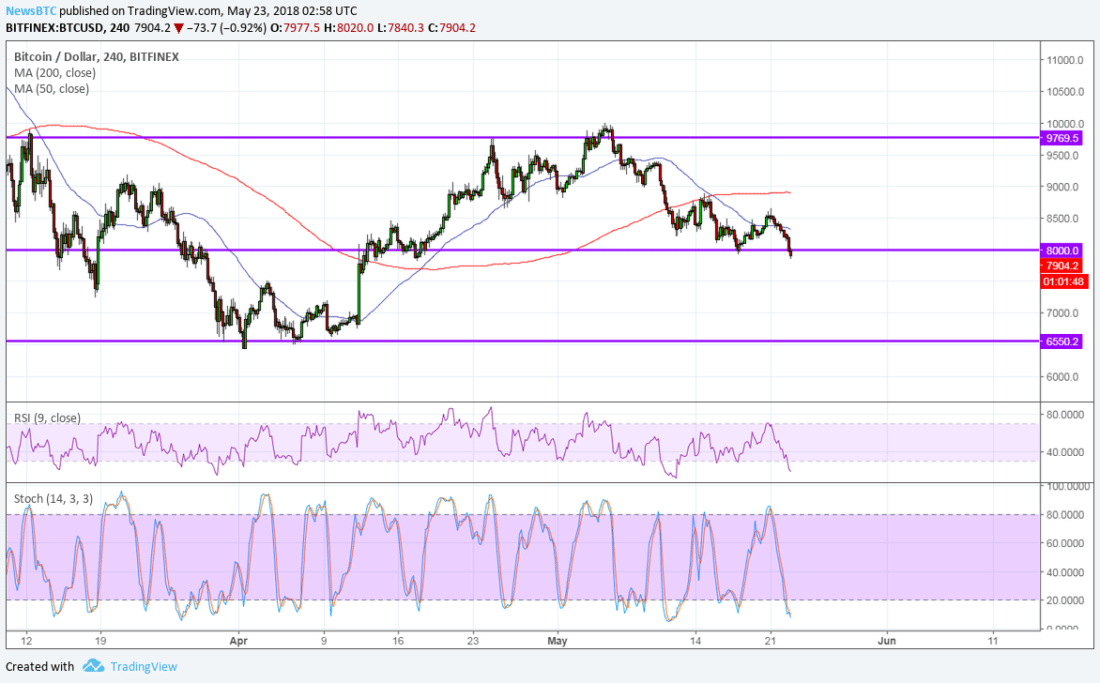
The Cloud metrics on the four hour time frame are; price below Cloud, bearish Cloud, bearish TK cross, and Lagging Span above price and below Cloud. A traditional long entry will not occur until price is above Cloud at ~US$8,942. An E2E long entry would trigger after a breach of Cloud at US$8,300. The previous four hour Kumo breakout led to a 27% price increase and both of the previous four hour E2E moves occurred in very few candles.

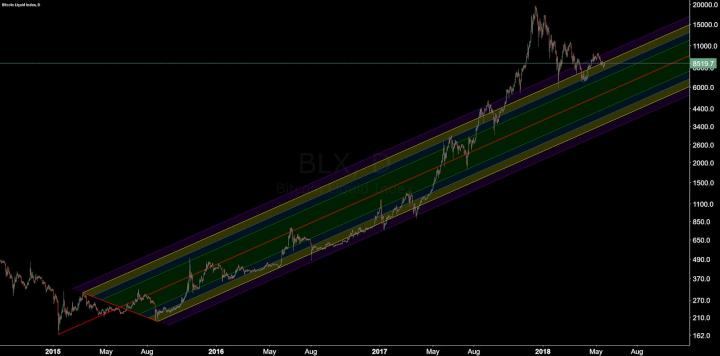
Penultimately, price has returned to the original upward trending Pitchfork beginning in 2015, with anchor points in January, May, and August of that year. Price broke North of this trend in October 2017 and again currently sits in the upper limits. A downside target of US~$5,700 is possible should price return to the mean (red line) of the prior trend.

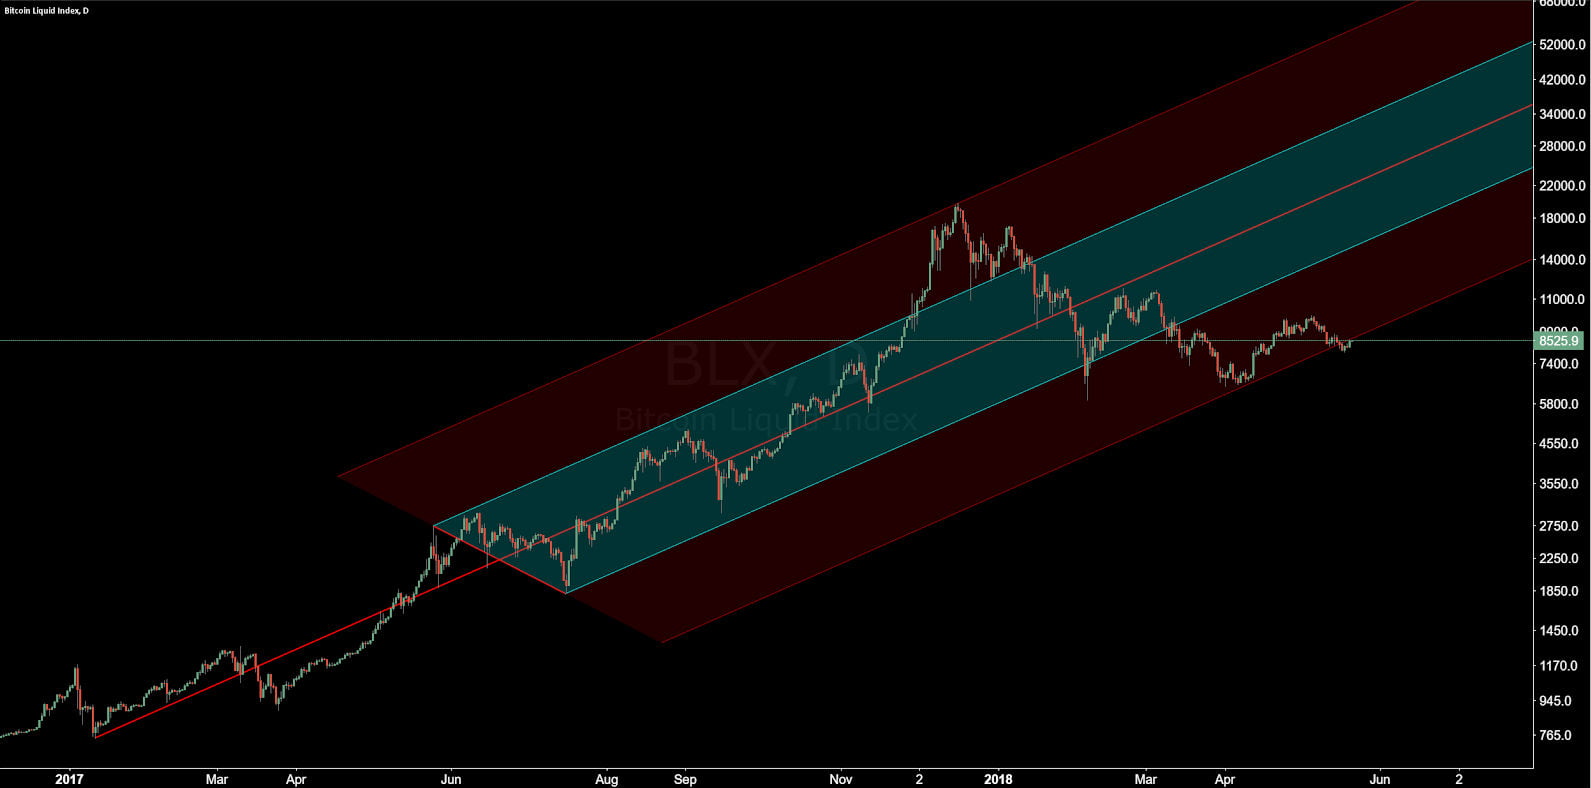
astly, another Pitchfork on the daily chart starting in 2017, with anchor points in January, May, and July, shows price reaching a similar distance below the mean (red line) as was reached above the mean in December. Price has closed this pitchfork for several days suggesting bearish invalidation. If price returns to inside the Pitchfork, a return to the mean is possible.


Conclusion

ASICs continue to drive conversations about the network, both in terms of centralization and increasing power consumption. Network usage and fees remain relatively low with SegWit and Lightning metrics steadily increasing. Exchanges and go-to-market apps continue to be developed.

Technicals suggest ongoing consolidation with several failed bullish reversal attempts, based on Ichimoku Clouds and a longstanding Pitchfork. The structure of price consolidation suggests bullish continuation, which may occur as early as May 31st. If the consolidation results in further downside a bearish target of ~US$5,700 is likely, based on a multi-year Pitchfork.


Author Josh Olszewicz, 21 May 2018

Posted by David Ogden Entrepreneur

Alan Zibluk Markethive Founding Member

Bitcoin Cash Price Weekly Analysis: BCH/USD Recoveries Remain Limited

Bitcoin Cash Price Weekly Analysis: BCH/USD Recoveries Remain Limited

Bitcoin Cash Price Weekly Analysis: BCH/USD Recoveries Remain Limited


Key Points

  • Bitcoin cash price got bid near the $1.130 level and started a recovery against the US Dollar.

  • There is a crucial bearish trend line forming with resistance near $1,320 on the 4-hours chart of the BCH/USD pair (data feed from Kraken).

The pair may continue to rise in the short term, but it is likely to face sellers near $1,320-40.

Bitcoin cash price is showing positive signs above $1,150 against the US Dollar. However, upsides in BCH/USD are likely to be limited by the $1,320 resistance zone.
 

Bitcoin Cash Price Upside Hurdle

This past week, there was a sharp increase in selling pressure on bitcoin cash price above $1,400 against the US Dollar. The price started a downside move and traded below the $1,350 and $1,280 support levels. There was even a break below the $1,200 pivot level, which opened the doors for more losses. It traded close to the $1,120 support level and a low was formed at $1,131.
 

Later, the price started an upside correction and moved above the $1,120 resistance. It also moved above the 23.6% Fib retracement level of the last drop from the $1,506 high to $1,131 low. However, there are many barriers on the upside near $1,300. An initial hurdle is near $1,128, which was a support earlier and it may now prevent gains. There is also a crucial bearish trend line forming with resistance near $1,320 on the 4-hours chart of the BCH/USD pair. Moreover, the 50% Fib retracement level of the last drop from the $1,506 high to $1,131 low is positioned near $1,318 to act as a hurdle.

Looking at the chart, the price may continue to rise in the near term towards $1,300. However, a break above $1,300 and $1,320 won’t be easy.
 

Looking at the technical indicators:

4-hours MACD — The MACD for BCH/USD is moving back in the bullish zone.

4-hours RSI (Relative Strength Index) — The RSI for BTC/USD is heading towards the 50 level.

Major Support Level — $1,150

Major Resistance Level — $1,320


Author: AAYUSH JINDAL | MAY 20, 2018 | 4:08 AM

Posted by David Ogden Entrepreneur

Alan Zibluk Markethive Founding Member

Plagiarist Those Dam Plagiarist

Plagiarism, Identity Theft, And False Promises All Too Common In Cryptocurrency Market

A Wall Street Journal analysis of 1,450 cryptocurrency offerings has unveiled unchecked plagiarism, rampant identity theft, and false promises of impossible financial gains.

‘LIES, DAMN LIES, AND STATISTICS’

Though it might not come as much of a surprise to those more intimately familiar with the cryptocurrency space, a Wall Street Journal review of 1,450 documents for digital coin offerings as unveiled 271 indicators of fraudulent tactics — including “plagiarized investor documents, promises of guaranteed returns and missing or fake executive teams.”

Investors have reportedly dumped more than $1 billion into the flagged projects, with $273 million already claimed as losses.

RED FLAGS

Plagiarism is one of the most rampant signs of fraudulent activity in the cryptocurrency space. The Wall Street Journal explains:

Of the 1,450 white papers downloaded from three popular websites that track coin offerings, the Journal found 111 that repeated entire sections word-for-word from other white papers. The copied language included descriptions of marketing plans, security issues and even distinct technical features such as how other programmers can interact with their database.

Swiss-based UTrust has had its whitepaper plagiarized numerous times –  something CEO Nuno Correia already knows. “We get a lot copies of our white paper,” Mr. Correia told The Wall Street Journal, “My picture, my description, my team, even our website was copied.”

Even high-profile projects like TRON (TRX), the 10th most valuable cryptocurrency by market capitalization, has been accused of plagiarism by many in the blockchain space, including Ethereum founder Vitalik Buterin.

The Wall Street Journal also found that “at least 121 of the projects didn’t disclose the name of a single employee and several of them listed team members who either didn’t appear to exist […] or were real people who said their identities were being used without their knowledge.”

Companies promising unrealistic returns — such as weekly payouts or doubled returns — without any risk are also running rampant in the cryptocurrency space, despite such practices being prohibited by the US Securities and Exchange Commission.

All of these red flags should be serious “warning signs for investors,” Bradley Bennett, a former enforcement chief at the Financial Industry Regulatory Authority, told The Wall Street Journal. Bennett explained:

There are going to be some legitimate players that emerge from this but it’s going to be a handful — a lot of it looks like penny-stock fraud with lower barriers to entry.

What do you think about the rampant fraud currently present in the cryptocurrency marketplace? Do you think this trend will continue, or die out as the cream rises to the top? Be sure to let us know in the comments below!

Author:
ADAM JAMES · MAY 19, 2018 · 8:00 AM
PLAGIARISM, IDENTITY THEFT, AND FALSE PROMISES ​


Alan Zibluk Markethive Founding Member