
Bitcoin Cash Price Weekly Analysis: BCH/USD Recoveries Remain Limited
Key Points
-
Bitcoin cash price got bid near the $1.130 level and started a recovery against the US Dollar.
-
There is a crucial bearish trend line forming with resistance near $1,320 on the 4-hours chart of the BCH/USD pair (data feed from Kraken).
The pair may continue to rise in the short term, but it is likely to face sellers near $1,320-40.
Bitcoin cash price is showing positive signs above $1,150 against the US Dollar. However, upsides in BCH/USD are likely to be limited by the $1,320 resistance zone.
Bitcoin Cash Price Upside Hurdle
This past week, there was a sharp increase in selling pressure on bitcoin cash price above $1,400 against the US Dollar. The price started a downside move and traded below the $1,350 and $1,280 support levels. There was even a break below the $1,200 pivot level, which opened the doors for more losses. It traded close to the $1,120 support level and a low was formed at $1,131.
Later, the price started an upside correction and moved above the $1,120 resistance. It also moved above the 23.6% Fib retracement level of the last drop from the $1,506 high to $1,131 low. However, there are many barriers on the upside near $1,300. An initial hurdle is near $1,128, which was a support earlier and it may now prevent gains. There is also a crucial bearish trend line forming with resistance near $1,320 on the 4-hours chart of the BCH/USD pair. Moreover, the 50% Fib retracement level of the last drop from the $1,506 high to $1,131 low is positioned near $1,318 to act as a hurdle.
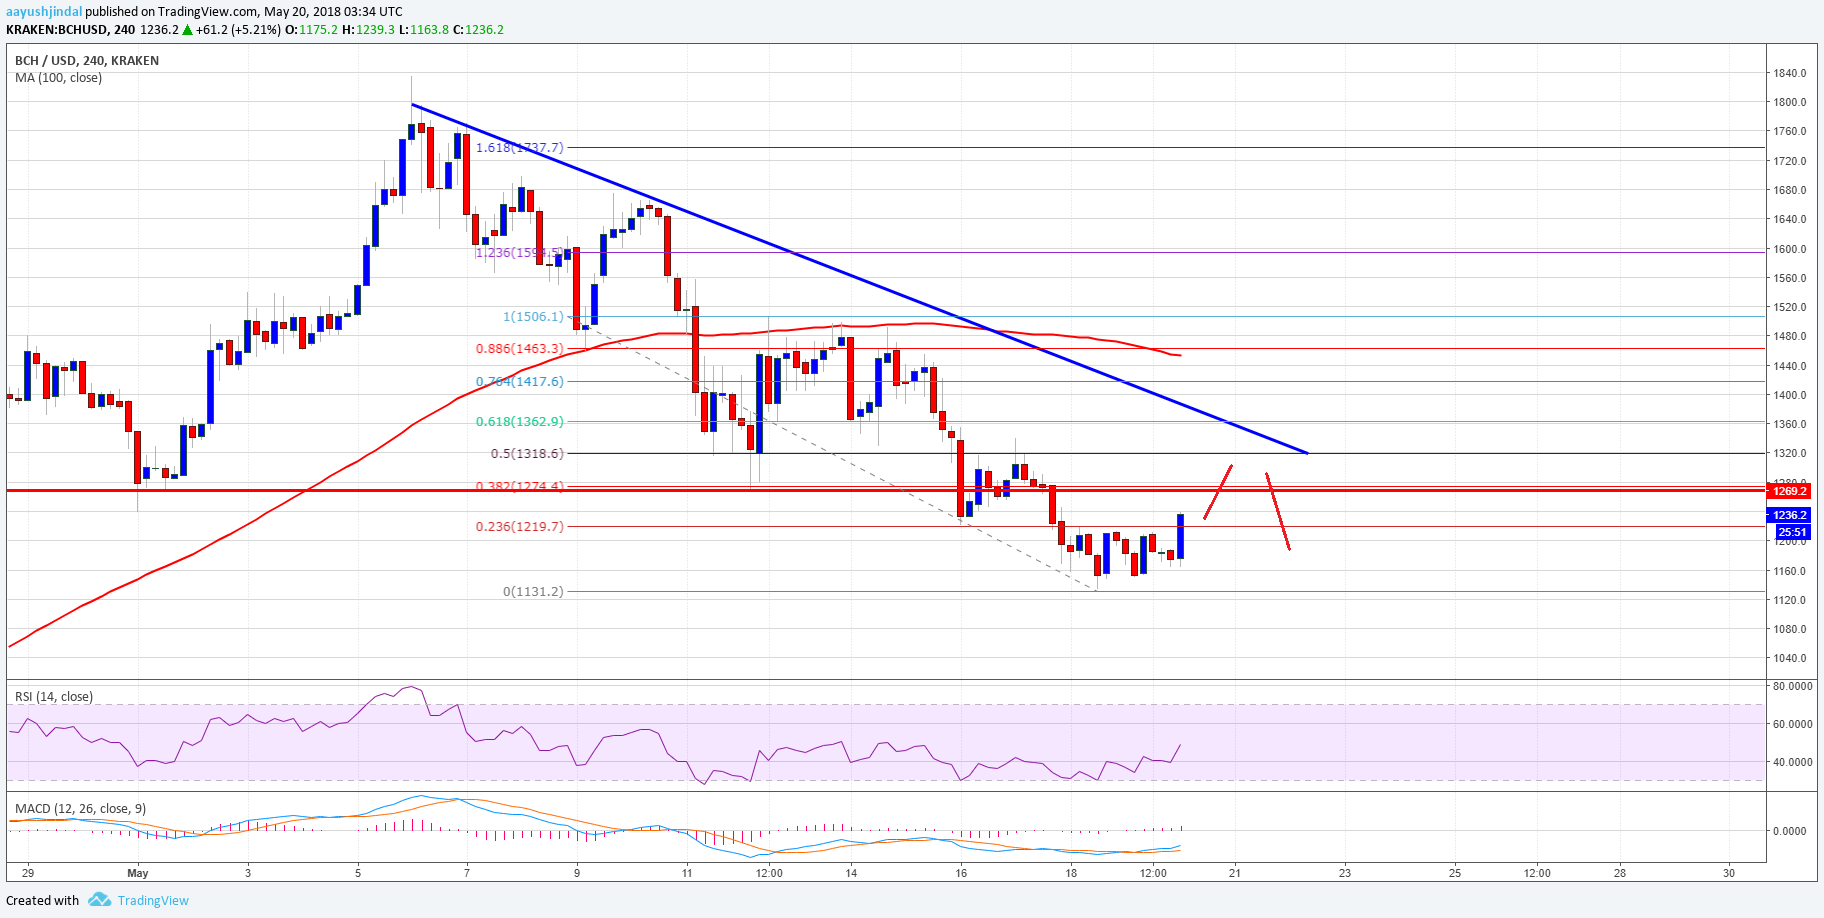
Looking at the chart, the price may continue to rise in the near term towards $1,300. However, a break above $1,300 and $1,320 won’t be easy.
Looking at the technical indicators:
4-hours MACD — The MACD for BCH/USD is moving back in the bullish zone.
4-hours RSI (Relative Strength Index) — The RSI for BTC/USD is heading towards the 50 level.
Major Support Level — $1,150
Major Resistance Level — $1,320
Author: AAYUSH JINDAL | MAY 20, 2018 | 4:08 AM
Posted by David Ogden Entrepreneur
Alan Zibluk Markethive Founding Member