Tag: bitcoin price

Bitcoin (BTC) Price Watch — Can It Finally Bounce?

Bitcoin (BTC) Price Watch - Can It Finally Bounce

Bitcoin (BTC) Price Watch — Can It Finally Bounce?


Bitcoin Price Key Highlights


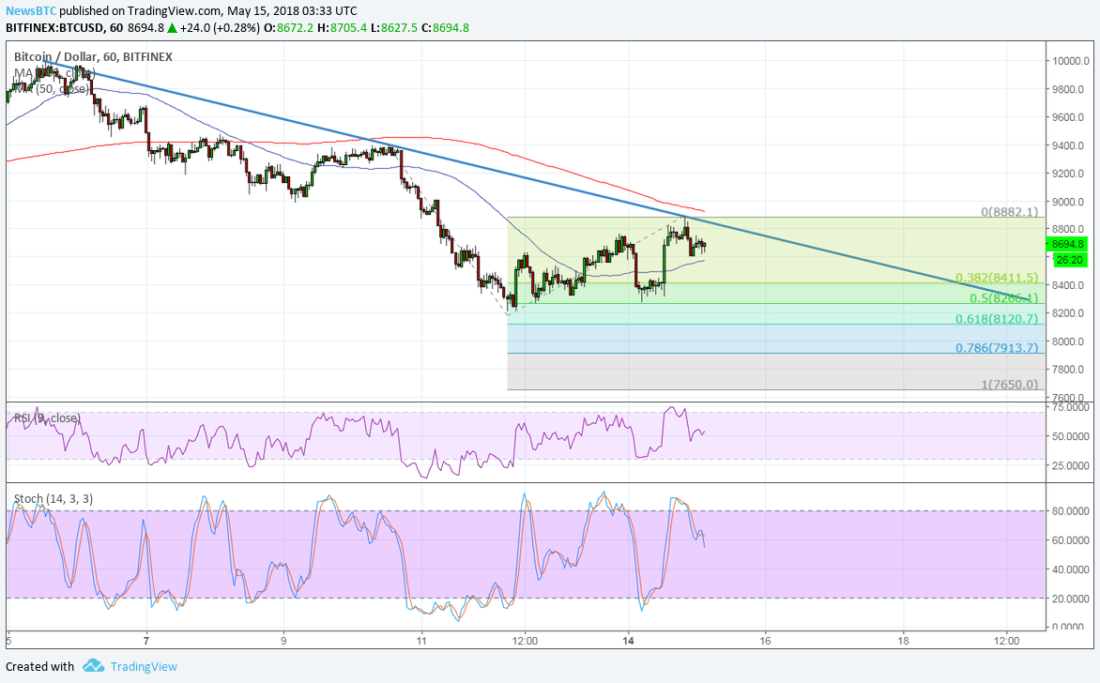
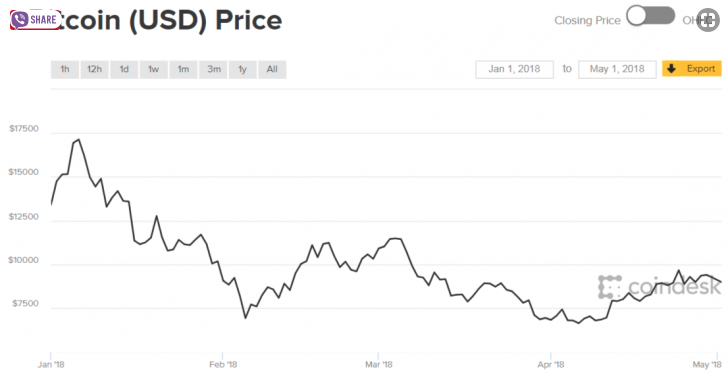
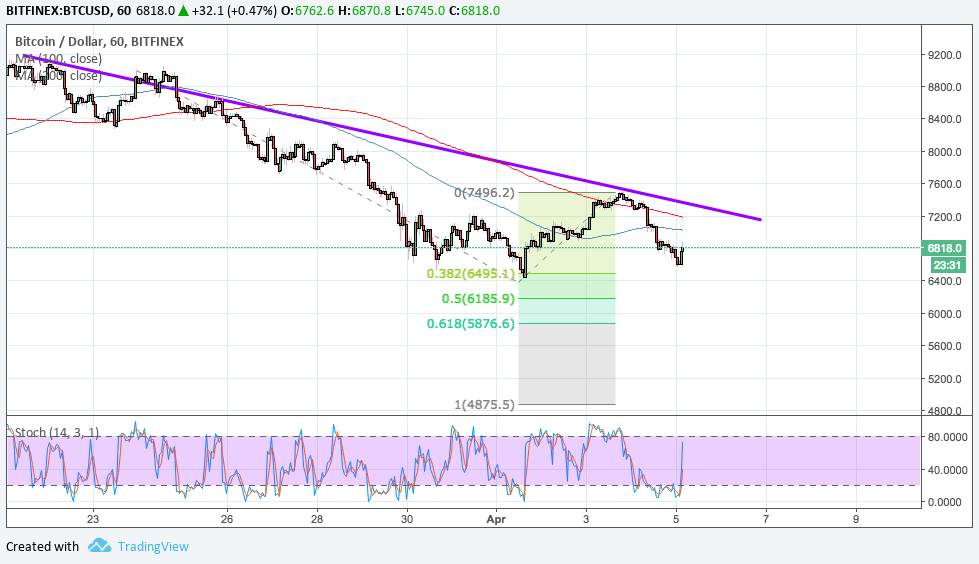
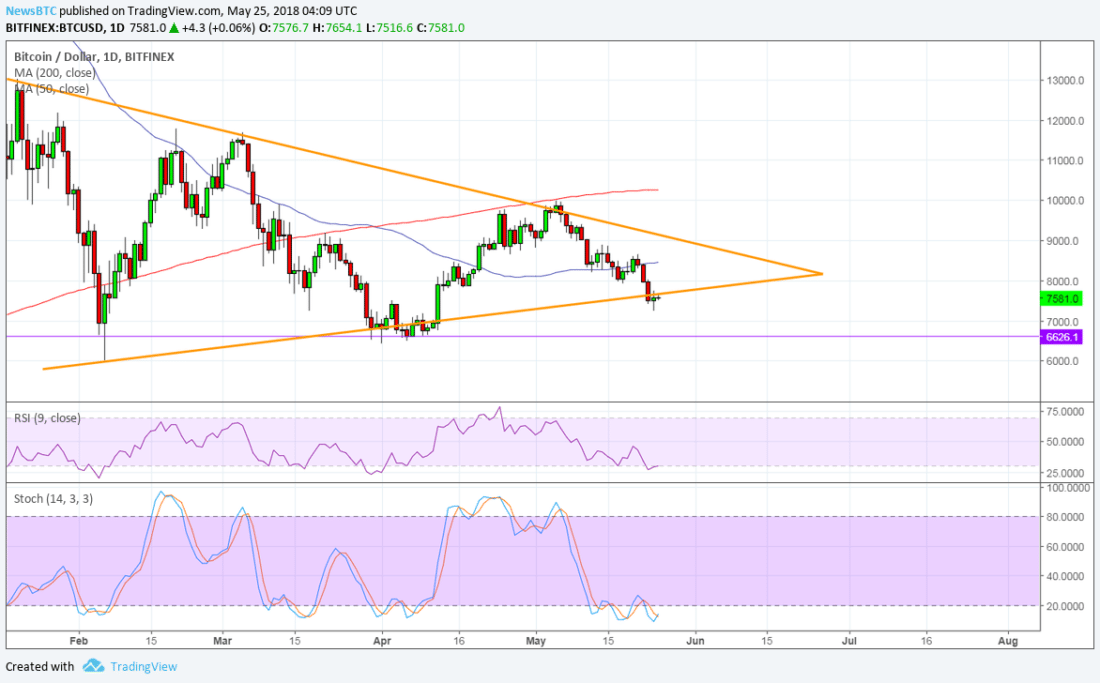
  • Bitcoin price is still inside its symmetrical triangle formation and is currently testing support.
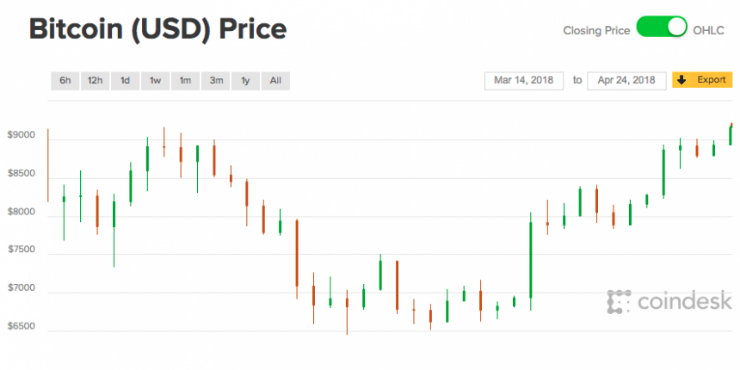
  • A bounce could take it back up to the resistance around $9,000 while a break lower could lead to a test of the next support at $6,500.
  • Technical indicators are showing mixed signals, so the move could mostly depend on market catalysts.

Bitcoin price has sold off to the very bottom of its symmetrical triangle formation, still pending a bounce or a break.

Technical Indicators Signals


The 100 SMA is below the longer-term 200 SMA so the path of least resistance is still to the downside. This suggests that a breakdown is more likely to happen than a bounce.

The gap between the moving averages is also widening to show accelerating bearish momentum. Also, price is below the 100 SMA dynamic inflection point to reflect continued selling pressure.

RSI is heading south to show that sellers have the upper hand, but the oscillator is already dipping into oversold territory to signal exhaustion. Turning higher could draw buyers back in and lead to a bounce back to the resistance. Similarly, stochastic is indicating oversold conditions but has yet to turn higher to signal a return in bullish pressure.


Market Factors

Regulatory fears are being blamed for the recent leg lower in bitcoin price, although this could prove positive for the industry in the longer run. The US Department of Justice is reportedly conducting a criminal probe into price manipulation practices involving cryptocurrencies.

It’s worth noting that the dollar has been on weaker footing following the FOMC minutes release and the recent announcements related to North Korea. Trump has cancelled his meeting with Kim Jong-Un for next month, reviving geopolitical tensions but weighing on the US currency. However, bitcoin price has been unable to take advantage of this as it also seems to have been dragged lower by risk sentiment.


Author SARAH JENN | MAY 25, 2018 | 4:28 AM


Posted by David Ogden Entrepreneur

Alan Zibluk Markethive Founding Member

Bitcoin Price Watch — How Low Can BTC Go?

Bitcoin Price Watch - How Low Can BTC Go

Bitcoin Price Watch — How Low Can BTC Go?

Bitcoin Price Key Highlights
 

  • Bitcoin price has bounced off the area of interest previously highlighted to signal that the selloff would resume.

  • Applying the Fibonacci extension tool shows how low bitcoin could go from here.

  • Technical indicators are showing mixed signals, with the oscillators reflecting more bearish pressure.

  • Bitcoin price is bouncing off the downtrend line and looks ready to resume the drop to new lows.

Technical Indicators Signals

The 100 SMA is below the longer-term 200 SMA to confirm that the path of least resistance is to the downside or that the selloff is more likely to continue than to reverse. The 200 SMA also lines up with the downtrend line to add to its strength as a ceiling.

However, the gap between the moving averages is narrowing to signal a potential upward crossover or return in bullish momentum. The 100 SMA might also be able to hold as dynamic support. If so, a move past the trend line, swing high and $9000 mark could confirm that an uptrend is taking place.

RSI is turning lower to show that sellers have the upper hand. Stochastic has also made its way out of the overbought zone and is heading south, so bitcoin price might follow suit. The 38.2% extension is at the $8400 area and the 50% level is close to the swing low. Stronger selling momentum could take bitcoin price to the 78.6% extension at $7913 or the full extension at $7650.

BTC/USD 1-hour Chart from TradingView
 

Market Factors

Bitcoin price seems to be off to another shaky start for the week as another failed attempt at breaking past $9,000 has drawn more selling pressure and spooked some bulls. However, positive updates in the industry are still popping up and could ultimately allow the climb to resume.

At the moment, what’s keeping investors on edge is the possibility that Mt. Gox will short another set of bitcoin to pay off its creditors. An estimated 8,000 coins are still up for selling, so this could have a huge weight on price.


Source: https://www.newsbtc.com/2018/05/15/bitcoin-price-watch-low-can-btc-go/
 

Posted by Daving Ogden Entrepreneur

Alan Zibluk Markethive Founding Member

Bitcoin price analysis -BTC/USD gets badly beaten, poking at $9,000 — Gary Cohn believes in crypto, but not in Bitcoin

Bitcoin price analysis -BTC/USD gets badly beaten, poking at $9,000 — Gary Cohn believes in crypto, but not in Bitcoin


  • BTC/USD broke below local support levels with no obvious triggers.

  • former president of Goldman Sachs Gary Cohn supports the idea of global cryptocurrency.


Bitcoin lost over 8% in just three days, crashing from $10,000 to below $9,000. BTC/USD is trading at $9,017, after a short dip to $8,960. The coin is 3% lower than 24 hours before. BTC has moved into a dangerous support zone as a sustainable movement below $9,000 threshold will trigger selling orders and push the coin deeper into the bearish territory. The downside may be partially explained by US Dollar growth on international markets.


Meanwhile, former president of Goldman Sachs Gary Cohn said that the world will have a cryptocurrency after all, but it won't be Bitcoin. He believes that we will end up with something easier and more user-friendly.


"I'm not a big believer in bitcoin. I am a believer in blockchain technology," Cohn explained in the interview with CNBC. "I do think we will have a global cryptocurrency at some point where the world understands it and it's not based on mining costs or cost of electricity or things like that," he added.


Bitcoin technical picture


The hourly chart shows that BTC/USD is trading below both 200 and 50-SMAs that are located at $9,276 and $9,383 respectively. They are likely to limit the upside on approach to $9,400. Once it is broken, the upside may be extended towards $9,584 (100-SMA). On the downside the vital support comes at $9,000. This psychological level coincides with 50% Fibo retracement of the downside movement from $1,1567 to $6,483. Once it is broken, $8,700 will come into focus.


BTC/USD, the hourly chart


Author Tanya Abrosimova

Posted by David Ogden entrepreneur


Alan Zibluk Markethive Founding Member

Up 33% — Bitcoin’s Price Just Had Its Best Month of 2018Up 33%

Up 33% - Bitcoin's Price Just Had Its Best Month of 2018

Up 33% — Bitcoin's Price Just Had Its Best Month of 2018

Bitcoin's price rose 33 percent against the U.S. dollar in April, making it the best month of 2018 for the world's largest cryptocurrency.

Data from CoinDesk's Bitcoin Price Index (BPI) shows that May began with bitcoin's price at the $9,244.32 mark — a 33 percent jump from its April 1 start of $6,926.02. This marks the greatest rise in bitcoin's price this year, and one of only two months where it rose at all within the period.

Bitcoin's price fell overall in January and March, and only rose 1.4 percent in February, according to BPI data.
Indeed, bitcoin fell by nearly a third in each of the negative months, dropping from $13,860 on January 1 to $10,166 on February 1, and even more drastically — from $10,309 to just below $7,000 — in March. While bitcoin has rallied this past month, it has yet to recover to the $10,000 mark, which it last fell below in mid-March.

That being said, these numbers hide the fact that bitcoin actually rose to past $17,000 in January before falling by nearly half to its February 1 level.

Similarly, bitcoin reached a low below $6,000 before recovering, as shown by the BPI. In other words, while it may have begun spending periods of time trading sideways, it remains volatile year-to-date,

Notably, bitcoin's transaction volume jumped by 93 percent month-over-month, while the number of off-chain transactions through exchanges jumped by a similar 95 percent. However, fees saw a similar jump, rising 90 percent in April, according to data collected by CoinDesk.

Bitcoin derivatives had a similarly positive month. Both the CBOE and CME saw their futures contracts trading volume spike this month, with CBOE in particular seeing more than 18,000 contracts traded in a single day on April 25, as previously reported.

Similarly, CME saw more than 11,000 contracts traded that day, roughly double its daily average.

Author Nikhilesh De  Updated  May 1, 2018 at 20:21 UTC
posted by David Ogden Entrepreneur
 

Alan Zibluk Markethive Founding Member

Bitcoin Price Climbs to 40-Day High Above $9,200

Bitcoin Price Climbs to 40-Day High Above $9,200

Bitcoin Price Climbs to 40-Day High Above $9,200


Bitcoin's price climbed above $9,200 on Tuesday to hit a 40-day high, according to data from CoinDesk's Bitcoin Price Index (BPI).


Following a steady increase over the past week, the price of world's largest cryptocurrency by market capitalization jumped above $9,000 soon after the morning trading session began around 00:30 UTC, after which it continued to climb up to as high as $9,220.97 at around 2:00 UTC.


The price is at its highest point since March 14, when bitcoin dropped $800 within one trading day to reach a one-month low around $8,000. Following the plunge, the cryptocurrency's price declined to as low as $6,593 on March 30, reflecting what is now a 39% gain since that market bottom.

The wider cryptocurrency market has seen price growth in the past month as well, climbing above $400 billion in terms of total capitalization, according to data from CoinMarketCap. That figure has shifted between $200 billion and $300 billion since March 18.


Currently, four out of the five largest cryptocurrencies by market capitalization are all seeing their prices at one-month highs, market data shows. Ethereum, the world's second largest cryptocurrency, is now above $660 after recently dropping below $400. The price of bitcoin cash has nearly doubled in the week since April 18, climbing back above $1,500 as of press time.


Author Wolfie Zhao Apr 24, 2018 at 04:00 UTC


Posted by David Ogden Entrepreneur

Alan Zibluk Markethive Founding Member

Tim Draper Predicts Bitcoin price to hit $250,000 in 4 years

Tim Draper Predicts Bitcoin price to hit $250,000 in 4 years

Tim Draper Predicts Bitcoin price to hit $250,000 in 4 years

According to Bitcoin bull Tim Draper, cryptocurrency could reach $250,000 in four years.


Tim Draper, the founder of Draper Fisher Jurvetson, wrote on Twitter about this on:

He also mentioned that earlier he tweeted a prediction about mistakenly posting $25k instead of $250k.

The investor, who commenced investments in Skype, Tesla, Twitter, and SpaceX, is known to have bought Bitcoin worth $30,000 from the U.S. government in 2014. However, those funds fell into government hands after an exchange that massively used the cryptocurrency, Silk Road, was shuttered.

According to Draper, he was fascinated by the idea that a digital currency is not bound to a government.

He told Fortune in January:

“So when Bitcoin showed up, I was all over it.”
 

DFJ also includes investments in other cryptocurrency-linked companies, such as exchange Coinbase.

The prediction was made based on the fact that the price of Bitcoin rose 17% to about $8,000. The cryptocurrency has been struggling since the start of 2018, with investors bothering about hints of regulatory crackdowns from governments including that of South Korea. Currently, the value of Bitcoin remains below its price at the start of the year, at about $14,000.


According to Barron’s estimates, It is uncertain on what basis Draper estimated a price of $250,000 by 2022. Investors, like Murray Stahl of Horizon Kinetics, hypothesize that Bitcoin is worth the value of all the currency in the world—about $361,000 per Bitcoin.
 

Anyhow it seems that Bitcoin would become a worldwide currency. Investors and critics also agree to the fact that, Bitcoin does face scalability issues. The Bitcoin network is presently handling about eight transactions in a second. Meanwhile, Visa says it can manage about 65,000 operations per second at maximum. And while the cryptocurrency community has at times tried to address the issue, it’s also divided the group.

And even now, the debate between Bitcoin Cash and Bitcoin continues, with early Bitcoin believer Roger Ver now batting for Bitcoin Cash.

“Bitcoin Cash is Bitcoin,” the investors wrote in a Twitter post, asserting that Bitcoin Cash is what Bitcoin should’ve been.


Author Renita April 14, 2018 12:04 pm

David Ogden Cryptocurrency Entrepreneur

Alan Zibluk Markethive Founding Member

Bitcoin Price Technical Analysis for 5th April 2018 – Next Potential Support Zones

Bitcoin Price Technical Analysis for 5th April 2018 — Next Potential Support Zones

Bitcoin Price Key Highlights

  • Bitcoin price is trending lower still after recently pulling back to a descending trend line on its 1-hour time frame.

  • Price is eyeing the next downside targets marked by the Fibonacci extension tool.

  • Technical indicators are giving mixed signals, but it looks like bears could still win out.

Bitcoin price has resumed its slide after a quick pullback, possibly attempting to make new lows from here.

Technical Indicators Signals

The 100 SMA is below the longer-term 200 SMA to confirm that the path of least resistance is to the downside. In other words, the selloff is more likely to resume than to reverse. The moving averages are also near the descending trend line, adding extra layers of resistance in the event of another pullback.

Stochastic is pointing up to indicate the presence of bullish pressure, though, so bitcoin price might still be able to bounce from here. Upon reaching overbought levels, the oscillator could turn back south to draw sellers back in.

The next potential support is at the 38.2% extension of $6495 near the swing low. The 50% extension is at $6185.90 and the 61.8% extension is at $5876.60. The full extension is located at $4875.50.

If bitcoin price is able to sustain its bounce at current levels, a double bottom pattern could form and this is often considered a classic reversal signal. That way, the neckline would be at $7500 and an upside break could lead to a rally of the same height as the formation.

Market Factors

Analysts point to the global uncertainty spurred by the trade tensions between China and the U.S. as one of the major culprits dragging bitcoin price lower. After all, traders are feeling less hungry for risk, putting their funds in safe-haven assets like the dollar and bonds instead.

Besides, traders might have also taken the recent pullback as an opportunity to liquidate their positions at better prices, fearing that rallies might not last very long in this market environment.
 

Author SARAH JENN | APRIL 5, 2018 | 4:48 AM
 

Posted by David Ogden Entrepreneur

Alan Zibluk Markethive Founding Member