
Bitcoin Price Analysis — A perfect storm
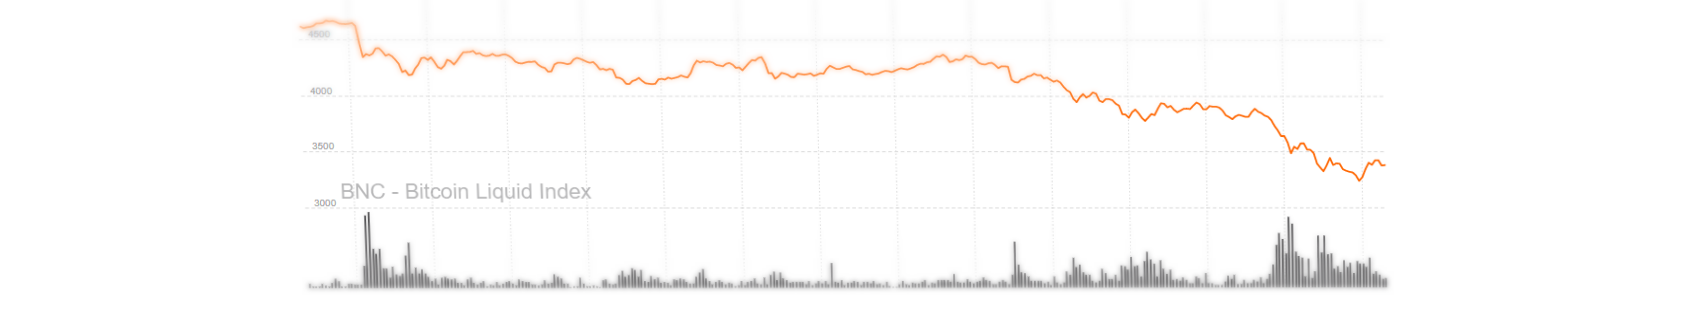
Bitcoin has dropped ~USD$400 in the past 24 hours, contributing to a ~USD$1450 drop in the past seven days. The leading cryptocurrency is down ~US$1150 Since the recent high of ~US$4950 on Sept 2nd, or nearly 30%. The lackluster performance can be attributed to both technical and fundamental factors.
On September 4th, China announced an outright ban of all ICOs, suggested refunding any collected funds in any ongoing crowd sales, and hinted at the shuttering of exchanges trading ICOs.
Earlier today, the oldest Bitcoin exchange in China, BTCC, announced it would end trading on September 30th. Competitors OKcoin and Huobi have yet to make announcements but they may also close their doors.
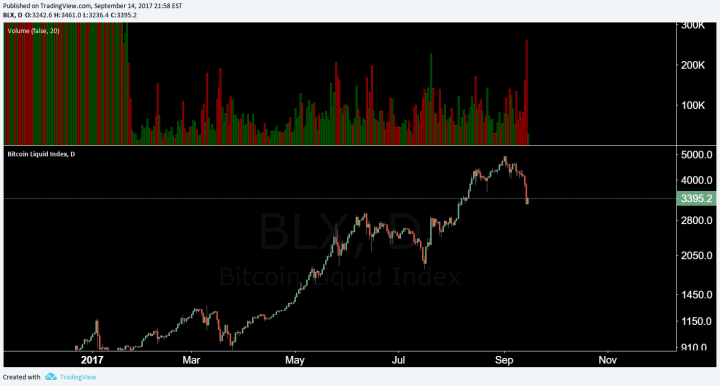
Needless to say, the market has reacted. Today marked the highest volume for a daily candle since Chinese exchange regulation in January, according to the BLX.
Not making a single clear statement, and therefore adding to fear, uncertainty, and doubt (FUD) is a classic move from the Chinese government and has occurred multiple times in the past.
The crackdown in China occurs in the context of an already overbought market. These conditions are almost identical to those in January, when the Chinese government reigned in Bitcoin exchange trading.
One high volume Bitcoin trader, who likes to protect their identity, had this to say about the situation. “I see regulations as a means of protecting the investor. During the 1920’s the United States stock markets were cesspools of corrupt insider trading, front running and taking advantage of the general population. The Securities Act of 1933 put an end to most of that, although many now a days would say otherwise, ending the so called ‘wild west of the stock markets’. Cryptocurrency, still in its infancy in my opinion, is just this; markets untamed a wild west ruled by non professional pundits and early adopters. I expect regulation will potentially be a good thing at first. However, coming into larger global adoption — I fear that cryptocurrencies as a whole will become just as easily manipulated, if not more, by the J.P. Morgans and Goldman Sachs’ of the world, as has been demonstrated during the tumultuous events of the past seven days.”
When fundamentals and technicals are united, the price move and reaction becomes amplified. So no, CEO of J.P Morgan Jamie Dimon’s comments this week didn’t crash Bitcoin. The market was due for a large correction after spending only eight days in the 3000 range.
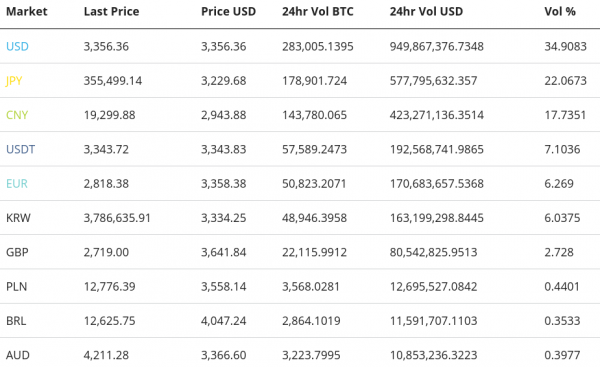
Exchange traded volume has been led by USD. Tether (USDT) is pegged to the dollar, and has also seen a significant bump in volume. This suggests that traders are using USDT as a safe haven from the pullback.
CNY volume accounts for <18% of exchange traded volume globally, but it’s clear that Chinese regulators have rattled the markets. Bitcoin has been selling for a significant discount in Yuan (CNY) markets, compared to other pairs, suggesting an influx of CNY traders selling bitcoin. CNY traders buying bitcoin had been paying a premium as recently as June.
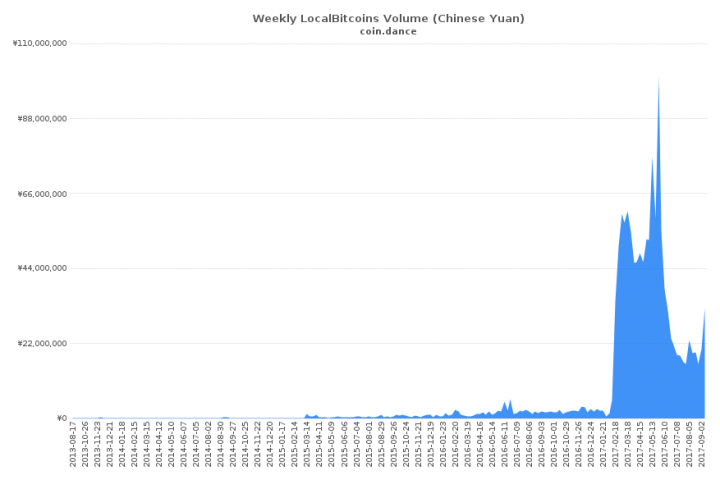
In light of the China exchange bans, pending or otherwise, we can expect OTC volume to increase significantly, just as it did following the increased regulatory focus from the Chinese government in January.
On a geopolitically related note, North Korea appears to be itching for attention on the world stage, having fired another missile over Japan. Should an offensive campaign, police action, or outright war arise in the region, we can expect a reaction from Bitcoin in some fashion.
There has also been a great deal of press around the potential large scale bitcoin acquisition by North Korea, including: bitcoin mining based on an uptick of internet activity in the region, hackers targeting cryptocurrency exchanges, and their involvement with the WannaCry virus. Despite all the press, it is difficult to prove the extent at which this is occurring without significant and in depth investigations on several fronts.
However, Japanese Yen (JPY) and South Korean Won (KRW) constitute 28% of global bitcoin trading. Should Bitcoin be seen as a safe haven asset in those regions, we can expect a bullish spike in price, lead by bitcoin trading for a premium in those markets.
Technical Analysis
On weeks like this one, with intense selling, it’s important to understand why the selling is occurring from a technical perspective.
On the weekly timeframe, there was building volume and RSI bearish divergence, which was confirmed last week. This meant that as price is rising, it is doing so on less volume and less momentum that it had previously. It was losing steam.
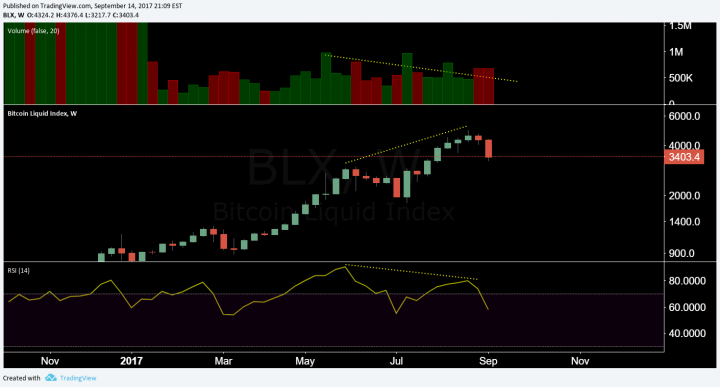
Divergences are considered lagging indicators and are difficult to trade off in isolation. Much like this divergence however, traders will watch the momentum fade and take action when they are certain of the direction.
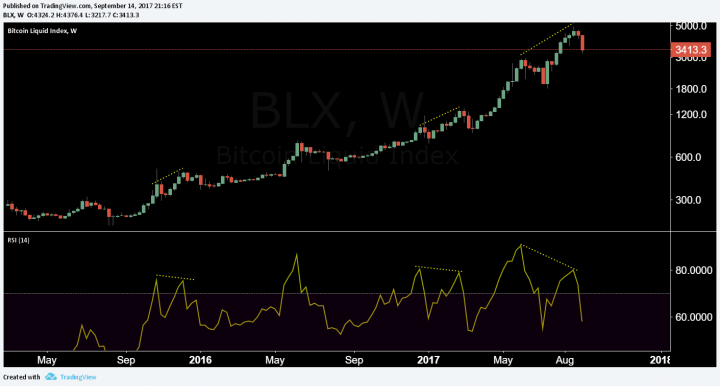
Bearish Divergences on the weekly chart have historically had significant pullbacks. Note that RSI divergences should be seen from the body of the candle, not the wick, because RSI is calculated at the close of the candle.
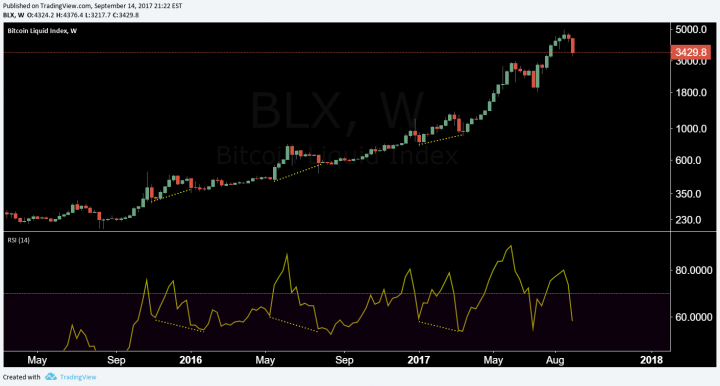
There have also been several hidden bullish divergences on the weekly chart, signaling weakening bearish sentiment. A hidden bullish divergence occurs when price makes a higher low on increased momentum. This means that in spite of increased momentum, price was unable to make a lower low.
This pattern has occurred several times on the weekly chart, and was a signal for strong bullish trend continuation. Should selling continue over the next week, there is the potential for another hidden bullish divergence.
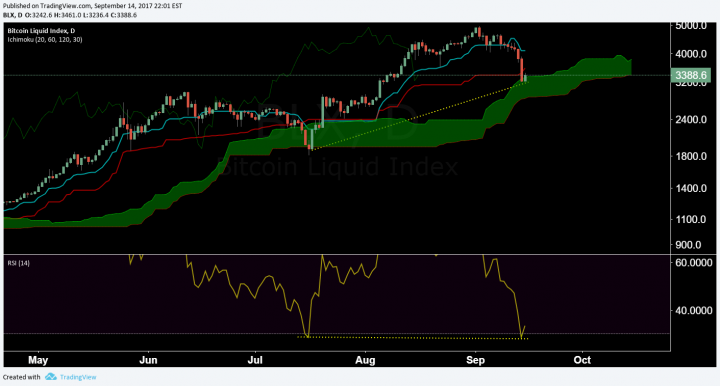
When looking for strong high probability support, look no further than the Ichimoku Cloud. The Kijun (red) represents complete mean reversion of the historic prices over the past 30 periods. This zone is currently holding as support at the time of this article. Additionally, there is an incredibly small, but existing hidden bullish divergence should this zone hold.
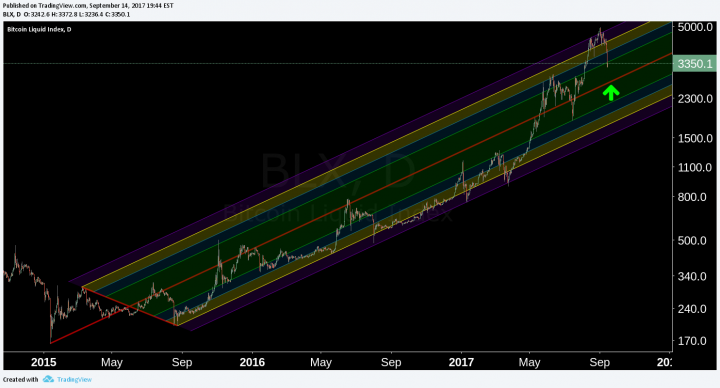
Another indicator to use when looking for support is the Pitchfork (PF). They provide diagonals that can be thought of as a potential reversal zones or support/resistance lines. The upper diagonal zones being ‘most overbought,’ or the top bounds of the trend, and the lower diagonal zones being ‘most oversold,’ or the bottom bounds of the trend.
Based on the longstanding PF, beginning in 2015, there is potential for increased selling down to the median line, ~USD$2800. This zone also represents support from the previous ATH made earlier this year.
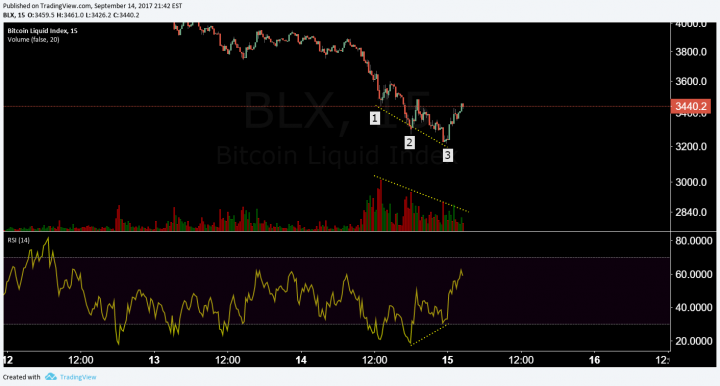
There is another noteworthy pattern developing on a shorter timeframe, the fifteen minute chart, a bullish three drives pattern with a growing volume and RSI bullish divergence.
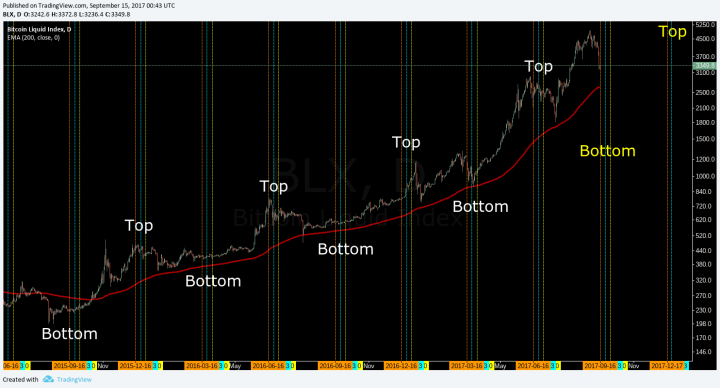
Lastly, we are approaching a rollover date on the OKcoin quarterly futures. Although the alternating top/bottom price pattern between quarterly futures contracts began to get much looser on the most recent rally to ~USD$5000, volatility surrounding the contract dates is not unusual. With a potential touch of the 200EMA on the daily chart, this may very well represent an interim bottom until December, when another bull run may occur.
Conclusion
A perfect storm of technical weakness and Chinese regulatory belt tightening, neither of which was fully priced in until at least today. Once regulations are finalized and FUD is abated, we can expect a strong rally, similar to that in January of this year. Technicals are already showing signs of bearish momentum weakening, with support targets holding on the daily close. Interestingly, this drop has been timed almost perfectly with the open of a new quarterly futures contract on OKcoin. Although the volume on the daily candle is the highest it’s been all year, we’ve yet to see a strong capitulation wick, signaling the end of the pullback.
Author Josh Olszewicz , 15 Sep 2017 — Bitcoin Price Analysis, Opinion, Technical
Posted by David Ogden Entrepreneur

Alan Zibluk Markethive Founding Member