
Bitcoin, Ethereum, Bitcoin Cash, Ripple, Stellar, Litecoin, Cardano, NEO, EOS — Price Analysis, March 21
The G20 considers cryptocurrencies risky, said the head of Italy’s central bank, but the broad consensus is that they should not be banned. After days of negative news, this is a positive shift for the cryptomarket. Led by Bitcoin, most cryptocurrencies are trying to pull back from their recent lows.
The plunge in cryptocurrencies from their December highs had scared off new wannabe cryptocurrency investors. Once the tide turns, we may see fresh money trickle back into the markets.
A recent survey by Finder.com shows that only 8 percent of the Americans own cryptocurrencies and another 8 percent plan to buy it in the future. With about 92 percent of the population still untapped, the markets have a long way to go. There is still enough skepticism and fear due to the huge volatile moves in the digital currencies. However, if traders plan properly, the risks are way less than made out to be.
Let’s watch the setups that are developing on the top coins.
BTC/USD
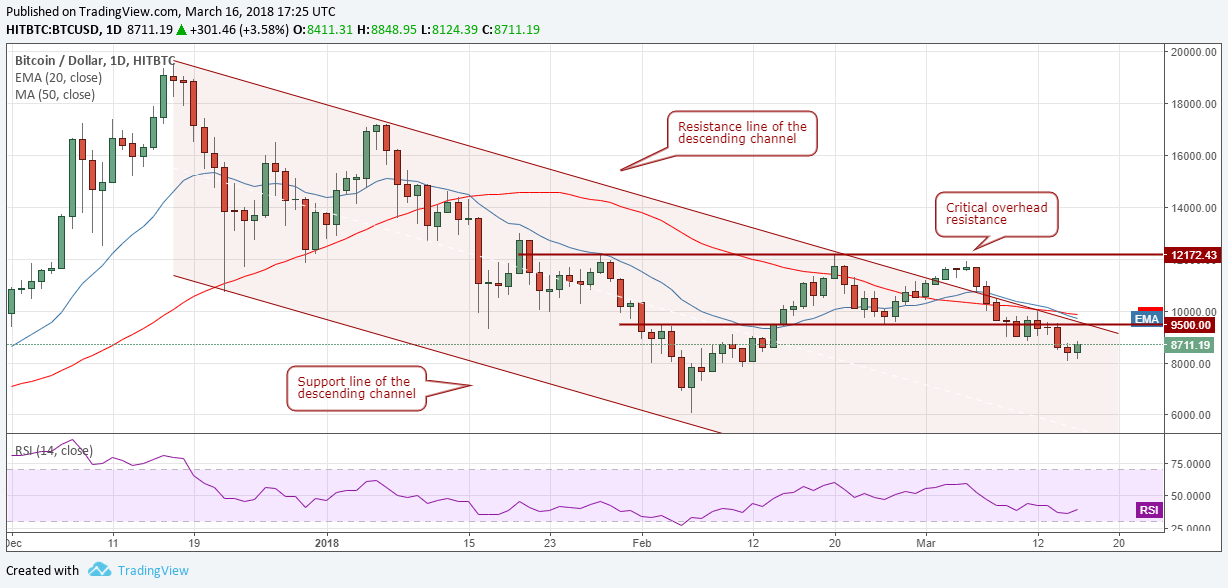
Bitcoin broke out of the descending channel on March 20, which is a bullish sign. It had broken out once earlier on March 02, but it could not sustain the higher levels. Within six days, the price was back inside the channel. Will the same thing repeat again?
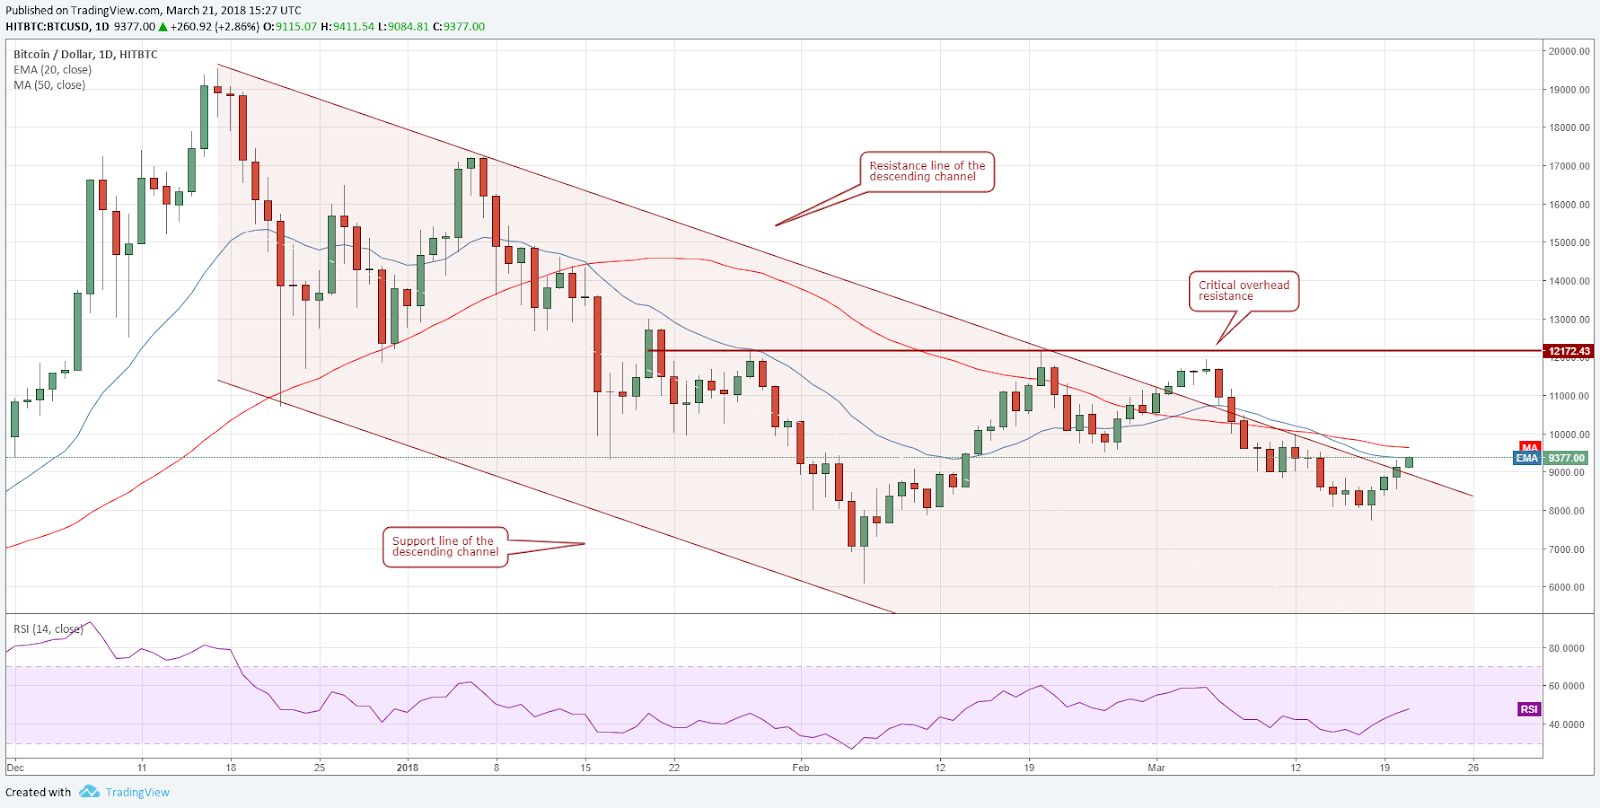
Just above the resistance line of the descending channel are resistances from the 20-day EMA and the 50-day SMA. We expect the bears to strongly defend this zone because once the price breaks out of this, the BTC/USD pair will rally to $12,172.
The next dip towards the $8,800 levels should offer the traders a good entry opportunity. They should purchase 50 percent of the desired allocation around $8,800 with a stop loss of $7,600. The remainder of the position can be added once the cryptocurrency is clear of both moving averages.
The target objective on the upside is a rally to $12,000.
ETH/USD
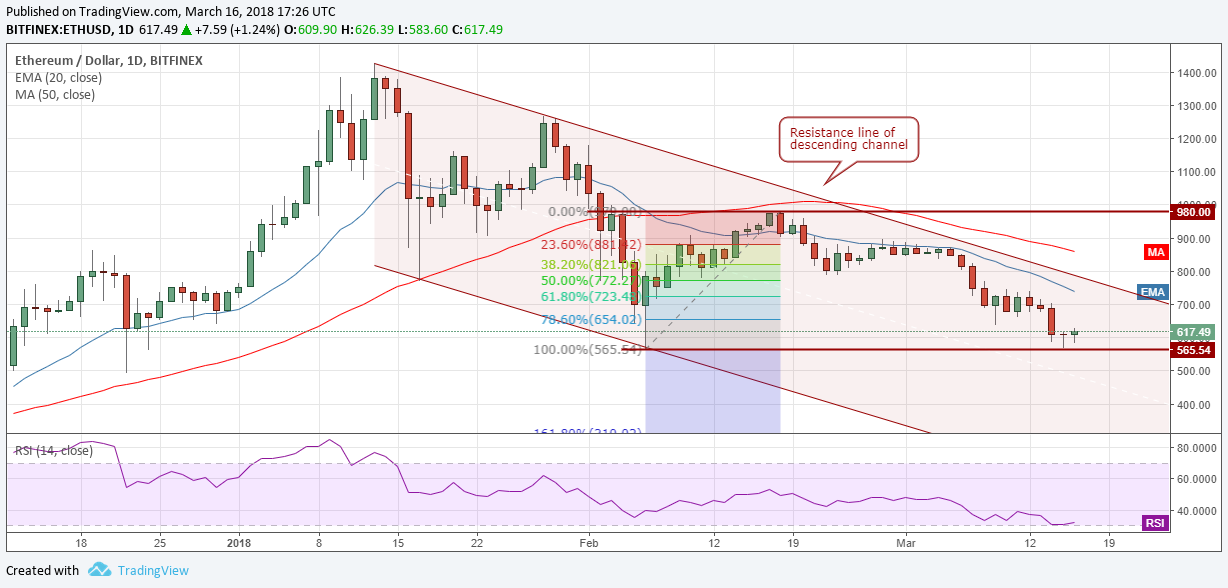
Ethereum is trying to break out of the descending channel (marked 2 on the chart) and the overhead horizontal resistance at $565.54. If successful, we’ll see a rally to the 20-day EMA at $650, which will most likely trigger bears selling.
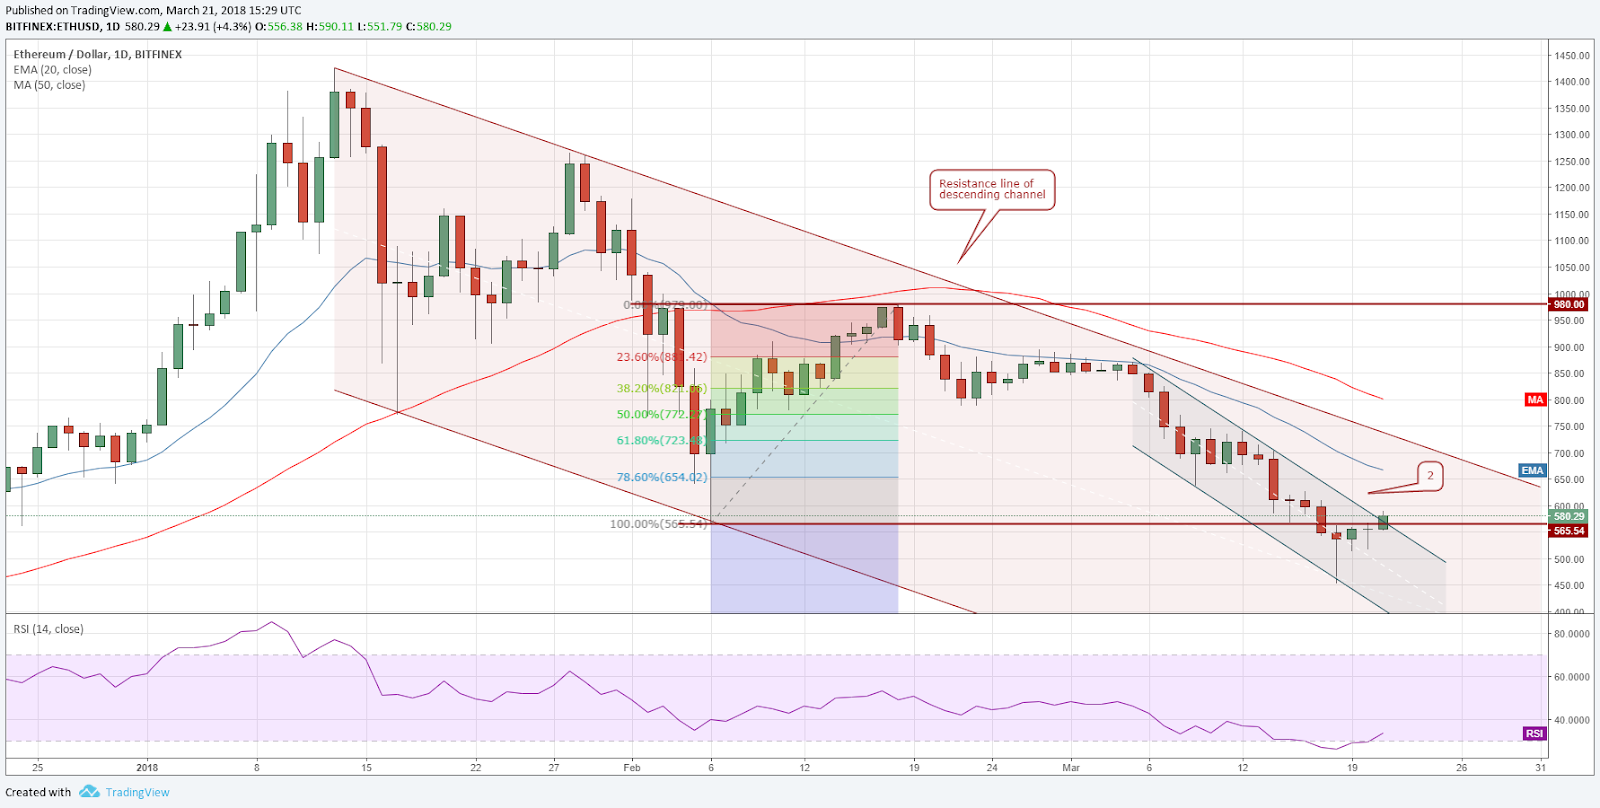
Above the 20-day EMA, the resistance line of the descending channel and the 50-day SMA are the other two significant resistance levels.
Aggressive traders can buy if the price closes above $575 (in the UTC time frame). The initial stop loss can be placed at $500. If the cryptocurrency struggles to break out of $660, the positions can be closed.
On the contrary, if the ETH/USD pair turns back below $565, it will become weak, and the price will experience a retest of the recent lows.
BCH/USD
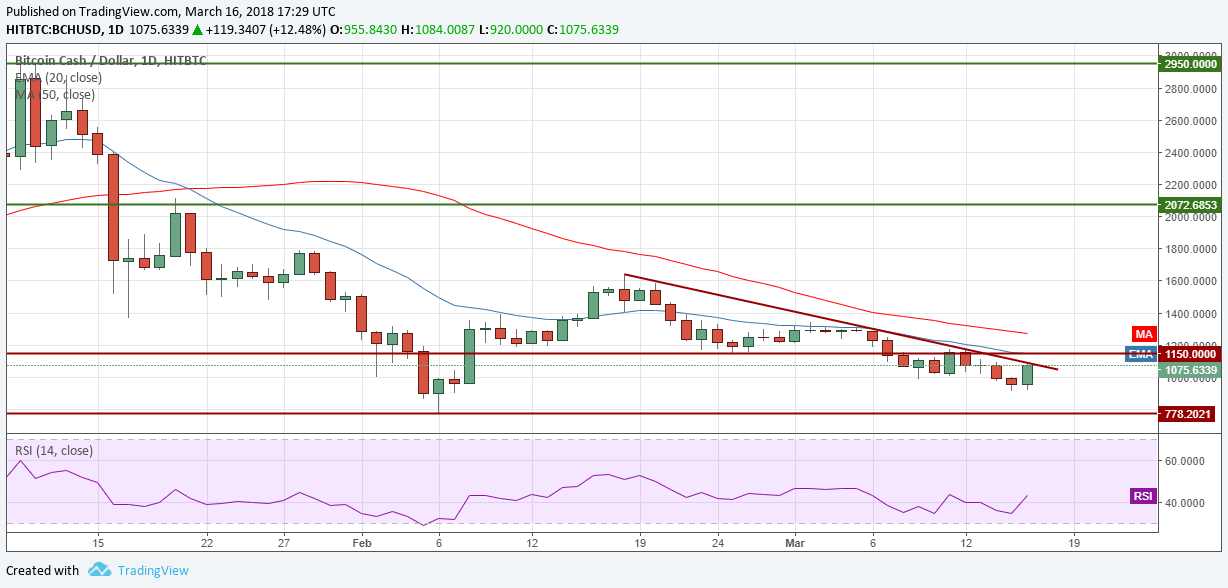
Bitcoin Cash has broken out of the downtrend line and is currently trying to move above the 20-day EMA. There are a number of resistances between $1,100 to $1,200.
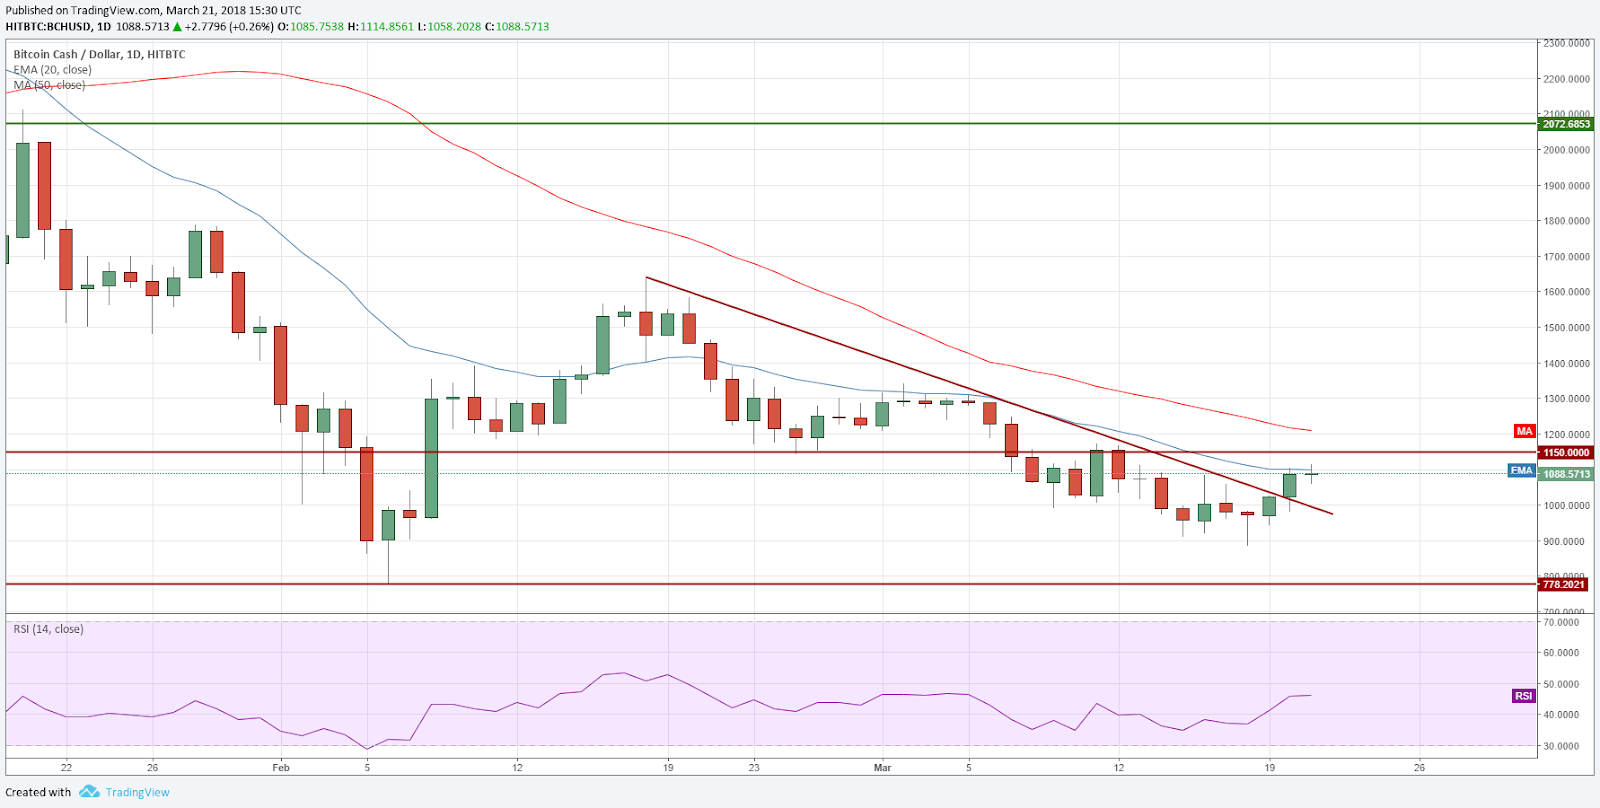
Currently, the cryptocurrency remains in a downtrend, as both moving averages are falling and the price is still below them. Once it sustains above $1,200, we can expect the BCH/USD pair to attract buyers and rally towards $1,600. We should wait for Bitcoin Cash to break out of the 50-day SMA before suggesting any trades.
On the downside, $980 and $880 will act as strong support on declines.
XRP/USD
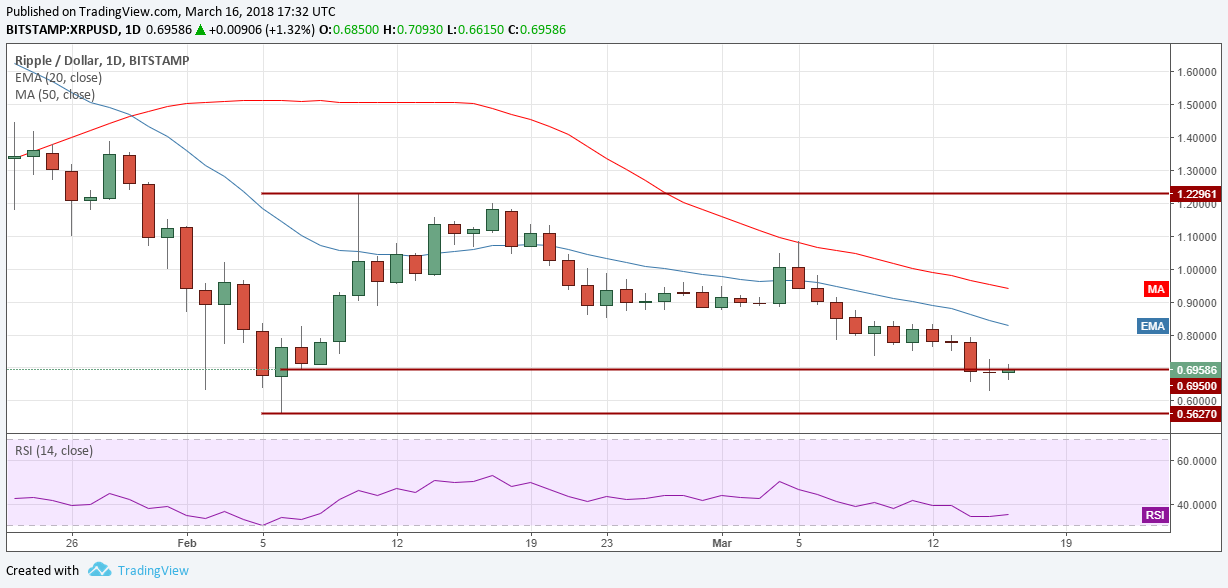
In our previous analysis, we had recommended a long position for Ripple at $0.71, which got filled on March 19. The stop loss for the trade is $0.53, which is just below the low on March 18.
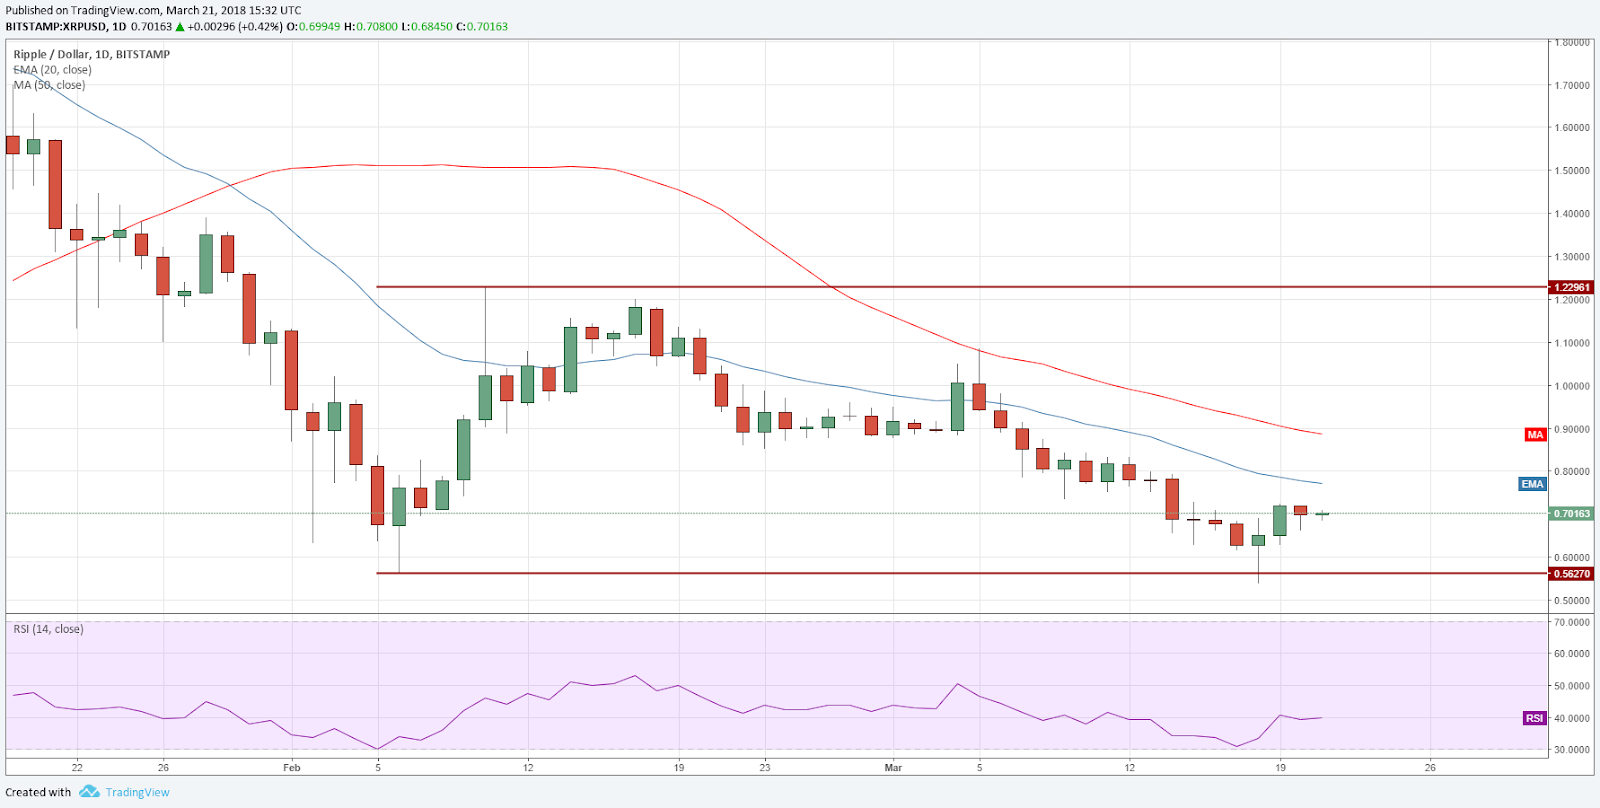
On March 20, the XRP/USD pair formed an inside day candlestick pattern. The range has shrunk again today, showing indecision between the bulls and the bears.
If the consolidation of the past two days breaks out of $0.73, the pullback will gain strength.
On the upside, the bears will pose a stiff challenge in the zone between the 20-day EMA and the 50-day SMA. Once the price breaks out of the $0.9 levels, the cryptocurrency should rally to $1.1 and then to the upper end of the $1.2 range.
We need to close the position if the price struggles to break out of any of the above-mentioned resistances.
XLM/USD
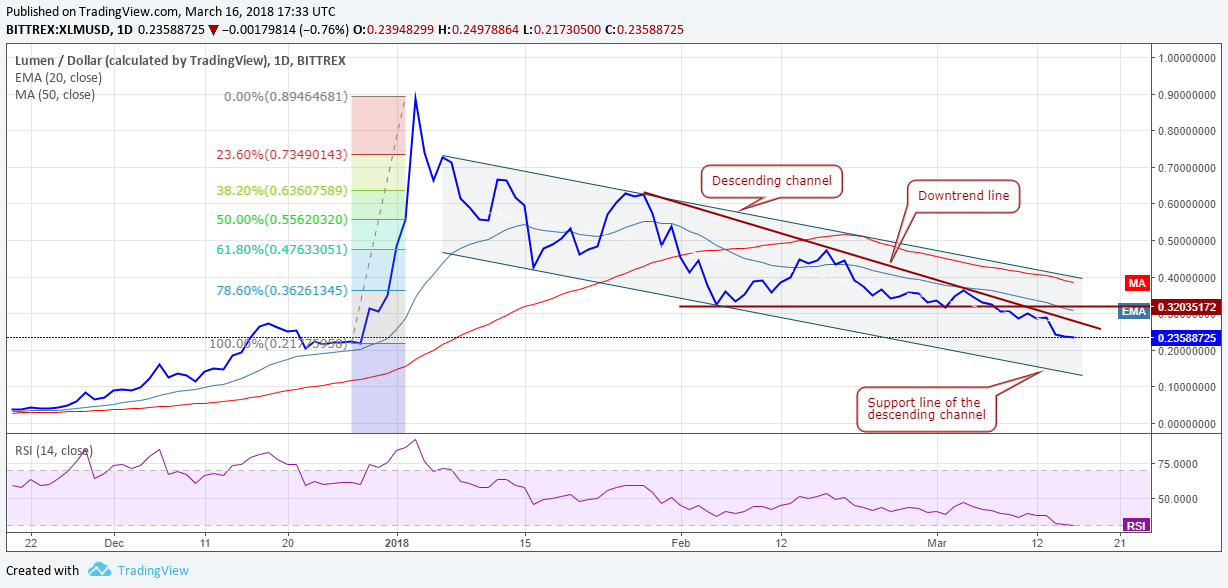
Stellar has pulled back from the lows of $0.2 to the 20-day EMA. It has broken out of the downtrend line meanwhile, which confirms that the negative momentum is weakening.
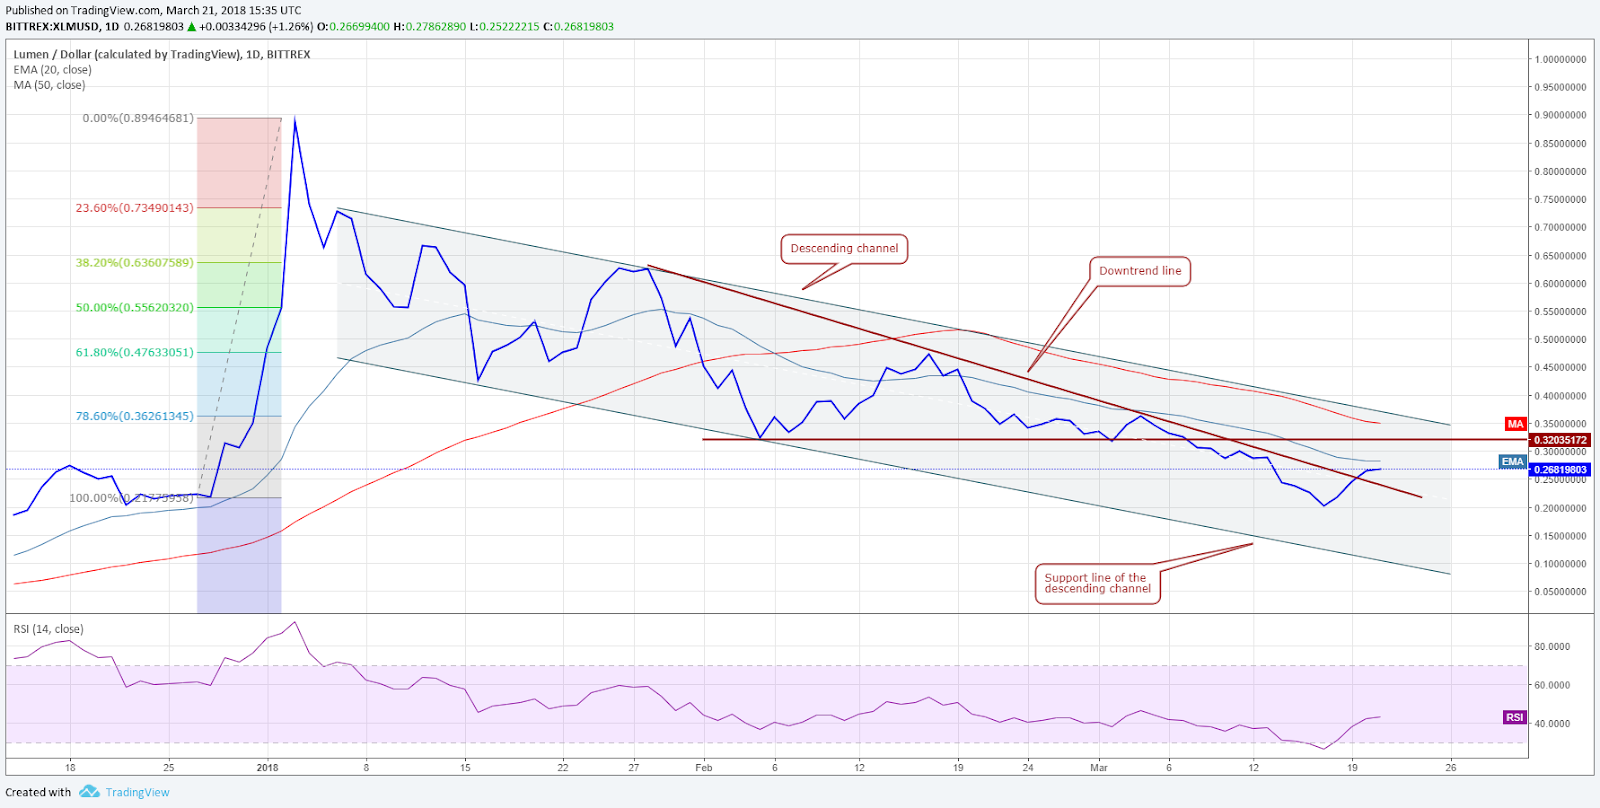
Still, the bears will try to defend the 20-day EMA. If the bulls purchase the subsequent dip around the $0.23 mark, it will offer the traders an opportunity to initiate long positions. We are suggestingan aggressive trade on the XLM/USD pair because we find that the 20-day EMA, the resistance line of the descending channel and the 50-day SMA have not offered a strong resistance previously.
The position can be covered if the daily close (UTC) is below $0.18. On the upside, we can expect a rally to $0.35. If this level is crossed, a move to $0.47 can’t be ruled out.
LTC/USD
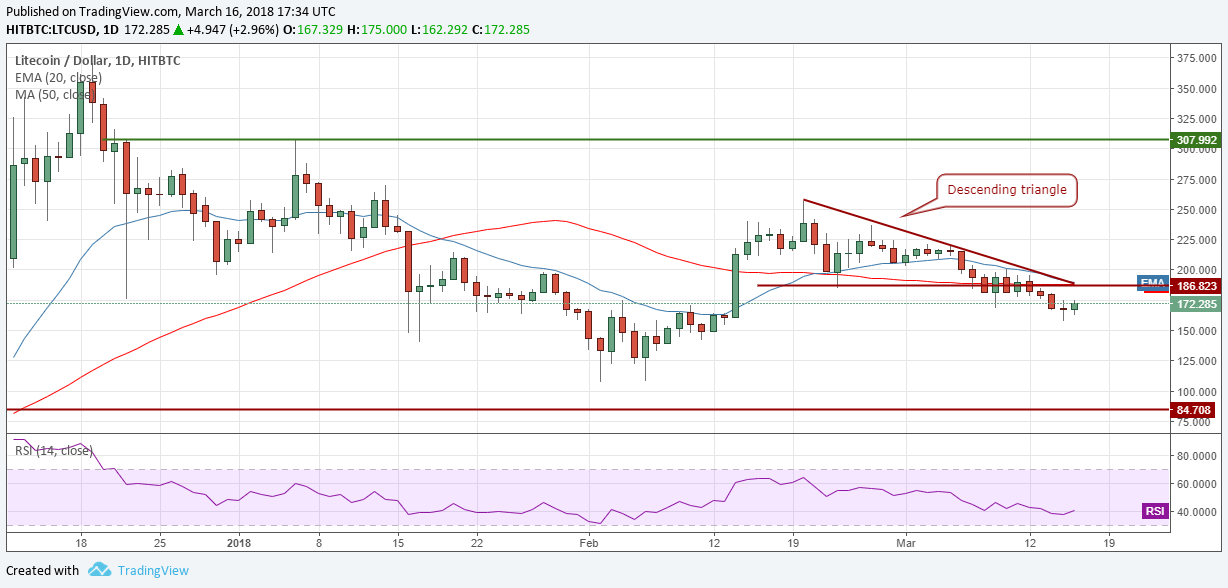
Litecoin looks strong as it has pulled back smartly from the lows of $144.544. It has broken out of the downtrend line, which is a positive sign. The current recovery might face a stiff resistance between the 20-day EMA and $187. We need to wait for the next dip to initiate long positions.
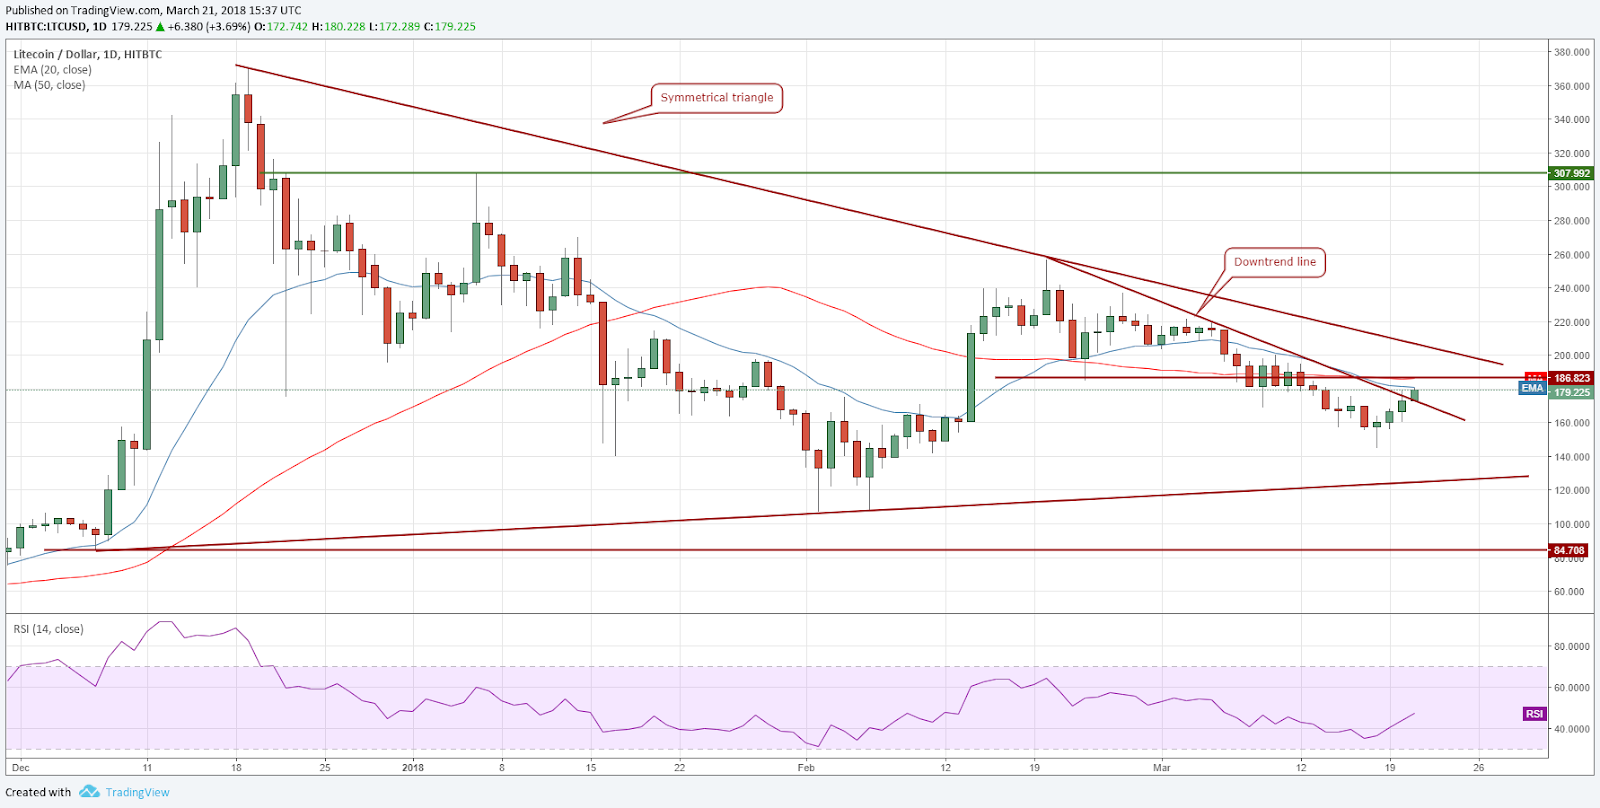
We find a large symmetrical triangle formation on the LTC/USD pair, which will break out above $205. Though the target objective is way higher, we can trade it for an up move to $240 and after that to $300.
Two possibilities are developing. Either buy on a dip towards $165 with a $142 stop loss or wait for a breakout above $205 to enter long positions with a stop loss at $180.
ADA/BTC
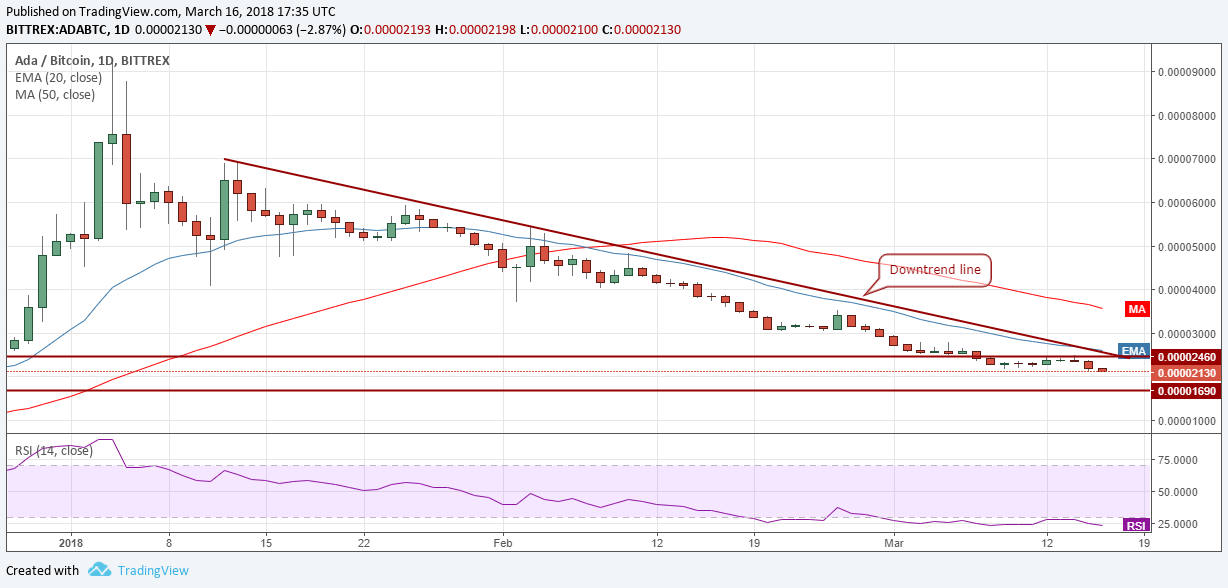
Cardano has broken out of the downtrend line for the first time since January this year. This is a major development as it shows that the trend is changing.
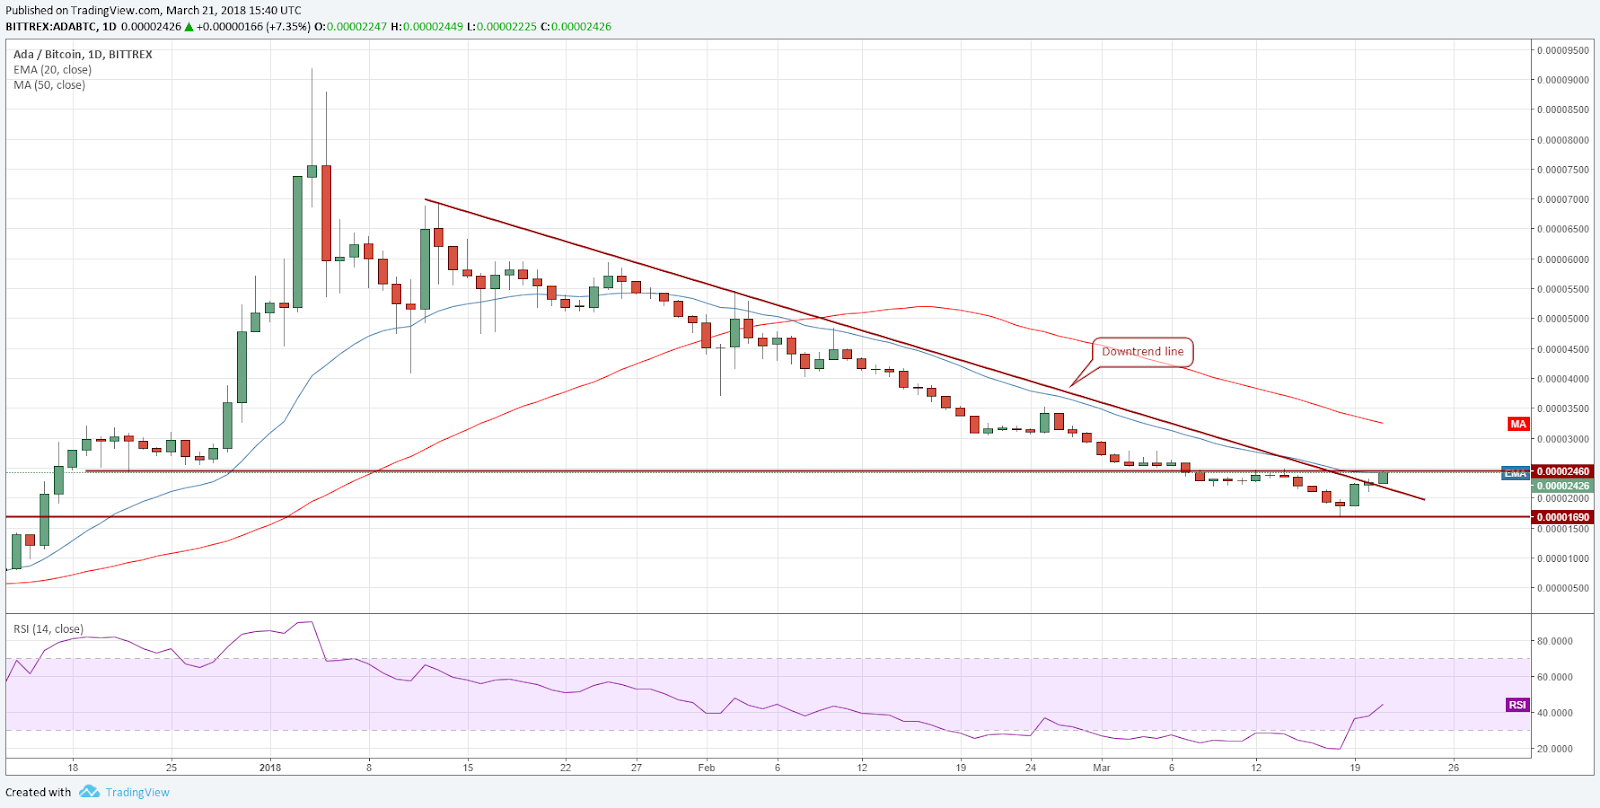
Right now, the ADA/BTC pair is facing resistance at 0.00002460. Once the bulls clear this resistance, a move to 0.000035 is possible.
Therefore, we suggest long positions if the price sustains at 0.000025 levels for four hours. The stop loss can be kept at 0.000016.
NEO/USD
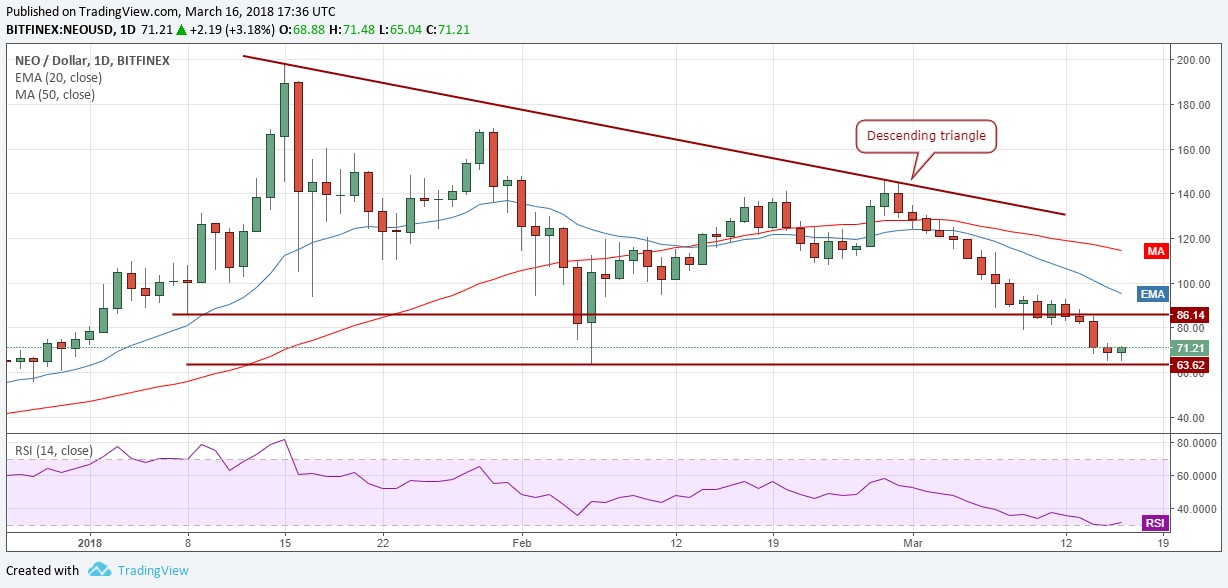
NEO has pulled back sharply from its recent lows of $49.04. This shows that the markets have rejected the breakdown and the lower levels. We expect a stiff resistance at the $86 levels.

If the NEO/USD pair finds support at the $65 mark during the next dip, it will signal a bottom formation and can be purchased with a stop below $48.
But if the price continues to march higher, then $90 is a good level to enter long positions with an initial stop loss of $70, which can be raised later. Our first target objective is a move to $115, where we anticipate selling. If NEO breaks out of $120, the momentum should pick up and push prices towards $140 levels.
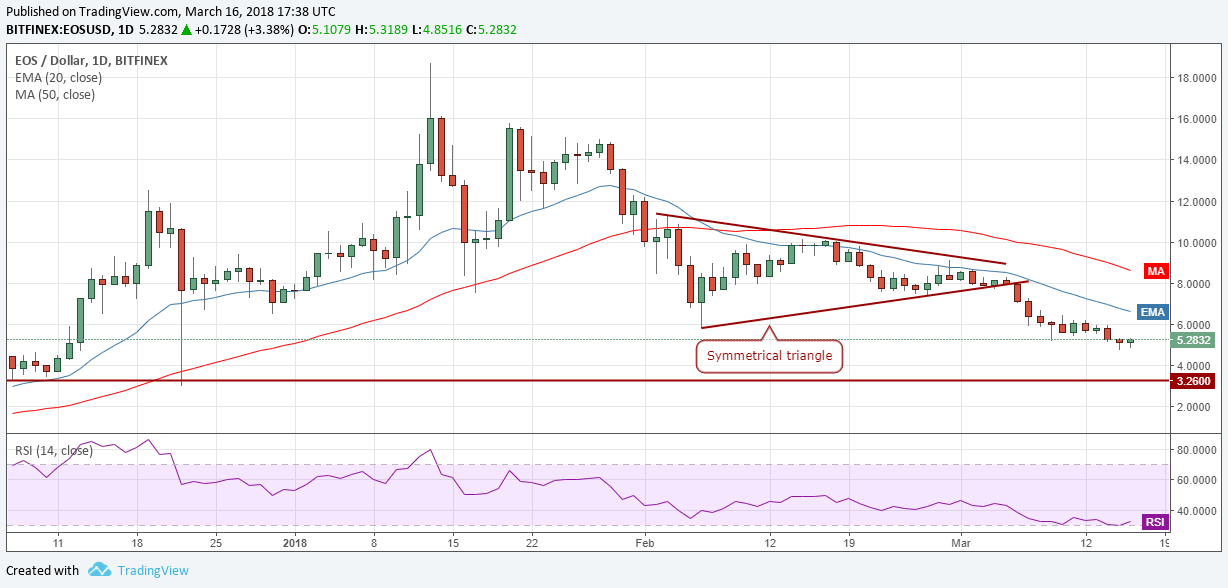
EOS/USD
EOS has risen sharply from its lows of $3.8723. For the past two days, it is facing selling at the 20-day EMA, but it has not given up much ground, which is a positive indication.
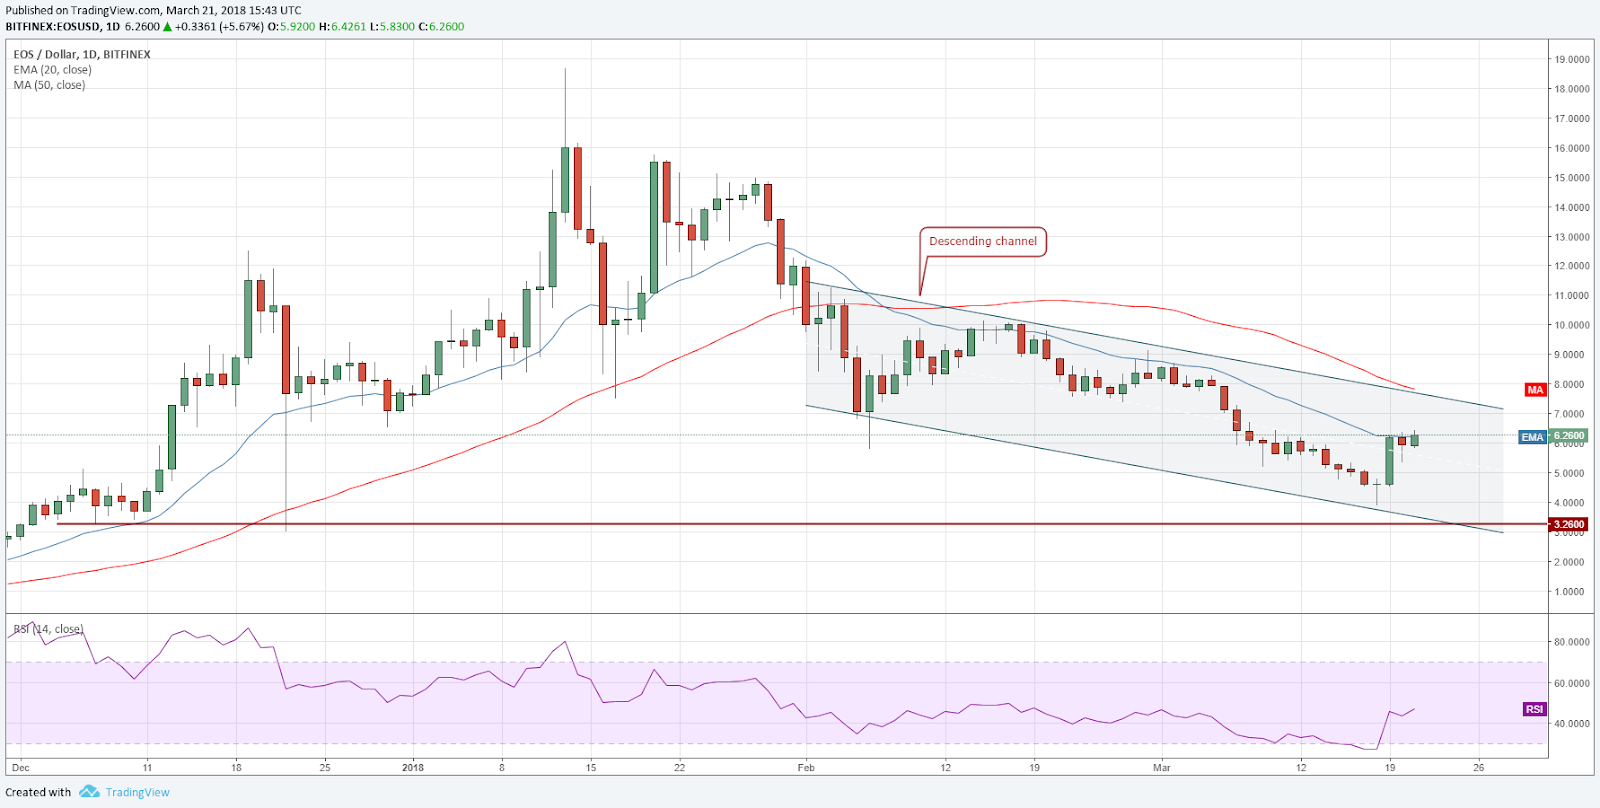
If the EOS/USD pair rallies above $6.3, it should move up to the resistance line of the descending channel.
Prices have turned down from the channel line on two previous occasions, hence, this will act as a stiff resistance. At the moment, we don’t have an attractive risk to reward ratio, that’s why we don’t recommend making any trades on it.
Author: Rakesh Upadhyay
Posted by David Ogden Entrepreneur
Alan Zibluk Markethive Founding Member