
Bitcoin Breakout — Price Action Analysis Hints at Possible Pullback
The bitcoin price [BTC to US dollar exchange rate] fell to a two-week low of $3,900 on Tuesday, a market movement that represented the biggest decline for the asset since July.
Triggered by the sudden news from China that the country’s financial regulators would ban initial coin offerings, the decline has also called into question just how big the appetite is for a higher bitcoin price given its 700% year-over-year gains.
However, traders appear to be bullish on the idea it can rise back above $5,000, the all-time high it set last Friday. In fact, traders who missed the rally appear to be utilizing the dip to board the bitcoin freight train — over the last 48 hours, the digital currency has recovered more than 50% of the losses it suffered during the four day period from September 2–5.
At press time, the BTC traded at $4,620, according to the CoinDesk Bitcoin Price Index. Week-on-week, bitcoin is down 2.69%. On a monthly basis, the cryptocurrency is up 34.8%.
Still, while the sharp rally from the weekly low of $3,900 has triggered speculation bitcoin is aiming for the fresh record highs, technical studies say the recovery lacks substance.
Money Flow Index [MFI] does not support further gains
The Money Flow Index (MFI) is an oscillator that uses both price and volume to measure buying and selling pressure. (MFI indicates rising or falling prices always through its own rise or fall.) If the MFI rises above the centre line [50], this is regarded as a buy signal.
Similarly, an intersection going down is regarded as a sell signal.
Daily chart
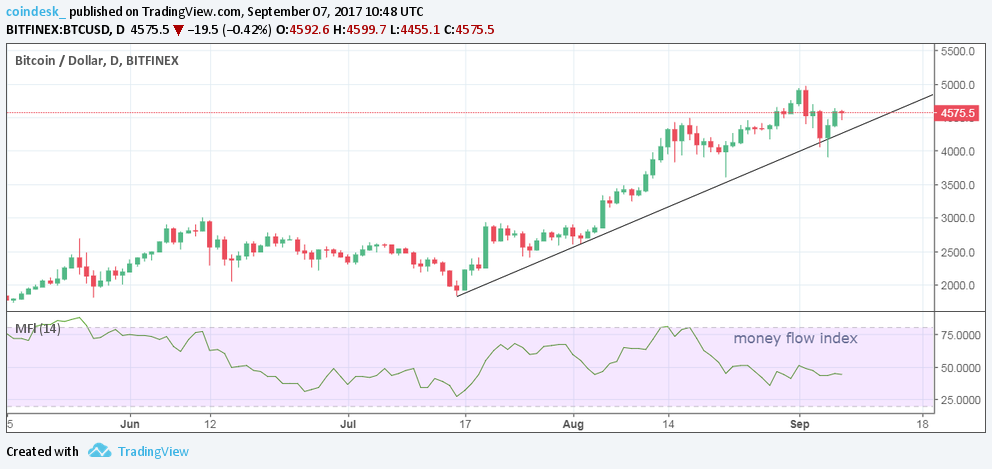
The MFI index is pointing downwards and shows no signs of life despite the sharp recovery from the weekly low of $3,900.
The weakness in the MFI could be an indication that the technical recovery lacks substance, i.e. lacks buying pressure and could have been fuelled by unwinding [profit taking] on the shorts.
4-Hour chart
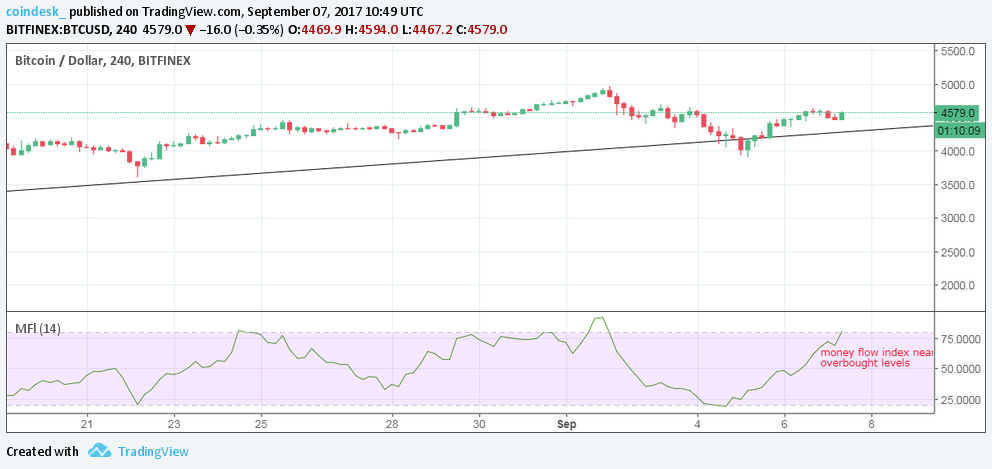
The MFI is close to overbought levels. Typically, an MFI above 80 is considered overbought and MFI below 20 is considered oversold. These levels are often used to identify unsustainable price extremes.
Overbought levels alone are not enough to turn bearish. However, in BTC’s case, the overbought MFI on the 4-hour chart could be read as a signal that the recovery from the low of $3,900 has ended. This is because, the daily MFI is bearish as discussed above.
Furthermore, the decline from the record high of $5,000 was triggered by a bearish price-RSI divergence. A bearish price RSI divergence is formed when prices form higher highs while the oscillator — in this case an RSI — forms significantly lower highs.)
As such, bitcoin’s outlook remains bearish unless we break above $5,000 as such a move would signal the bearish price RSI divergence is no longer valid.
View
Daily chart
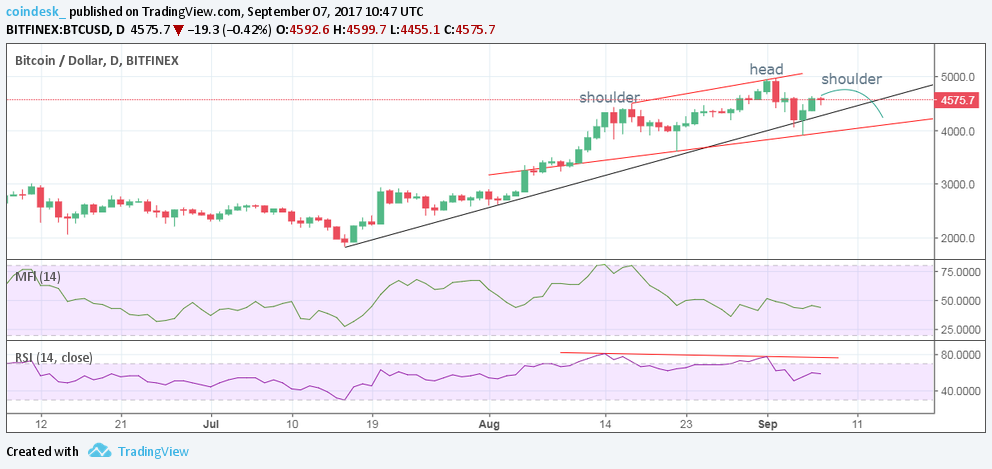
Bullish factors
- The rising trend line is intact and is likely to offer support at $4,265
Bearish factors
- As discussed above, the MFI is not in favor of further gains in bitcoin
- Bearish price-RSI divergence
- Potential head and shoulders pattern
BTC is more likely to break below $4,265, in which case a lower highs pattern would be confirmed. An uptrend, which is a series of higher highs and higher lows, reverses into a downtrend by changing into a series of lower highs and lower lows.
Lower lows would be confirmed if prices break below the recent low of $4,900.
Also note that a lower highs would increase the odds of the prices forming a head and shoulders [H&S] bearish reversal pattern. The Head and shoulders is a reversal pattern that, when formed, signals the security [in this case bitcoin] is likely to move against the previous trend.
The H&S neckline [line drawn from the left shoulder bottom and right shoulder bottom] support is seen at $3980 levels. A break below the neckline level confirms bullish-to-bearish trend reversal.
Bullish scenario
A break above $4,640 could result in a rally towards $5000, although caution is advised as only a move above $5,000 would make the bearish price-RSI divergence invalid and shall revive the rally set in motion from the July low of $1,826.
Disclaimer: This article should not be taken as, and is not intended to provide, investment advice. Please conduct your own thorough research before investing in any cryptocurrency.
Sep 7, 2017 at 14:20 UTC by Omkar Godbole
Posted By David Ogden Entrepreneur

Alan Zibluk Markethive Founding Member